---
title: "ChEn 433 Wind"
date: Class 19-20
lang: en-US
slideNumber: false
width: 1600
height: 1000
transition: fade
css: ../assets/style.css
theme: simple
title-slide-attributes:
data-background-image: "https://upload.wikimedia.org/wikipedia/commons/8/8f/Wind_Turbines_%285132099985%29.jpg"
data-background-opacity: "1.0"
verticator:
enable: true
menu:
enable: true
chalkboard:
enable: false
---
# Wind
What are the major issues associated with wind power?
::: incremental
* Intermittent wind
* energy storage
* Location of wind vs population centers
* Large land use
* Visual impacts
* [Birds](https://www.smithsonianmag.com/smart-news/black-wind-turbine-blades-help-birds-avoid-deadly-collisions-180975668/)
* [Lifetime, landfill](https://www.bloomberg.com/news/features/2020-02-05/wind-turbine-blades-can-t-be-recycled-so-they-re-piling-up-in-landfills)
:::
::: fragment
:::
::: notes
plots like this can be misleading. Global numbers may not matter. If cats only kill sparrows and there are tons of sparrows, but turbines kill important migratory birds, that would be a problem.
:::
# Wind, global
::: {.cols2}
::: {.col2-vp}
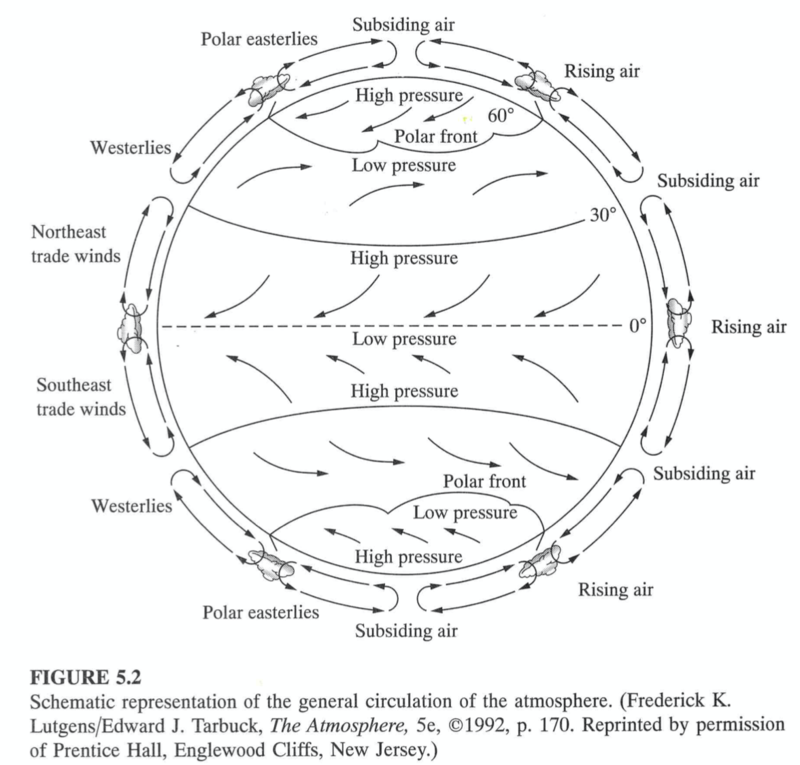
* Warm air rises at the equator
* Cold air sinks at the poles
* Three cells in each hemisphere
* [Hadley, Ferrel, Polar](https://en.wikipedia.org/wiki/Atmospheric_circulation)
* Rainforests
* Deserts
* Atmosphere is thin
* 50% of mass within 3.4 miles
* 99% of mass within 20 miles
* $D_\text{earth}\approx$ 8000 miles
* $\rightarrow$ 2D flow
:::
::: {.col2-v}
:::
:::
## Wind--Coriolis
::: {.cols2}
::: {.col2-v}
:::
::: {.col2-v}
:::
:::
## Wind--Coriolis
::: {.cols2}
::: {.col2-vp}
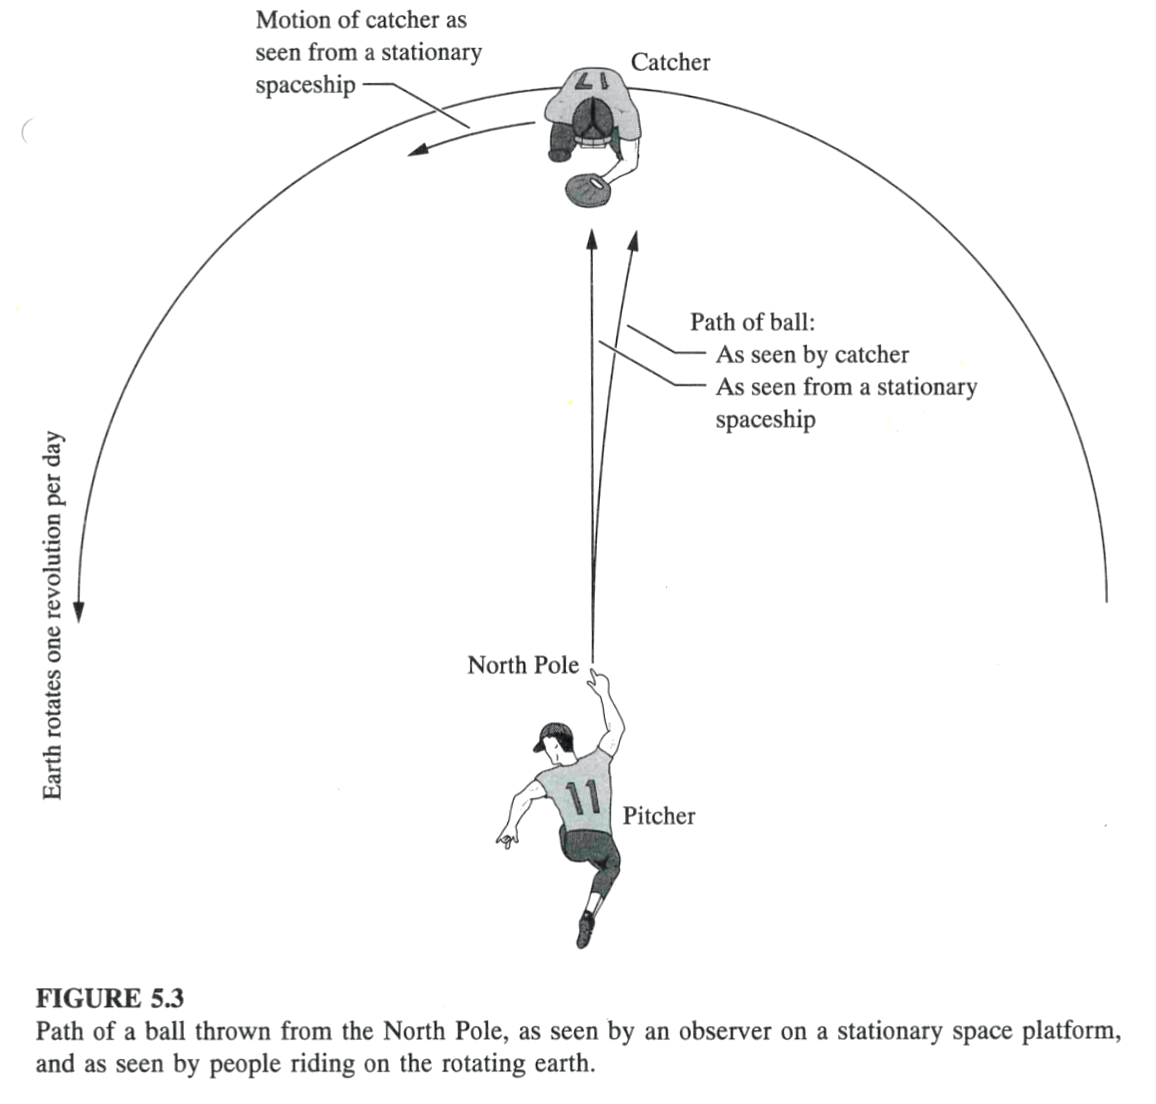
* Coriolis acceleration
$$a_c = 2v\omega\sin\phi_\text{lat}$$
* $\omega = 2\pi$ rad/day = $7.27\times 10^{-5}$ rad/s
* at $\omega = 40^o$ latitude (Provo), v=10 mph:
$$a_c=\text{2.85E-4 m/s}^2$$
* $\ll$ smaller than gravity (ignore for vertical motions)
* Typical horizontal P gradient = 1 Pa/km.
$$a = \frac{F}{m} = \frac{A\Delta P}{\rho V} = \frac{x^2\Delta P}{\rho x^3} = \frac{\Delta P}{\rho x}$$
$$a = \text{8.3E-4 m/s}^2\approx 3a_c$$
:::
::: {.col2-v}
:::
:::
## Wind--height
::: {.cols2}
::: {.col2-vp}
* horizontal $\nabla P$ are ~ const. with height
* $\rho$ decreases with height
* So, $a$ increases with height, hence v
* Friction boundary layer $\lesssim$ 500 m
* geostrophic wind above this
* [Velocity increase with height](https://en.wikipedia.org/wiki/Wind_gradient)
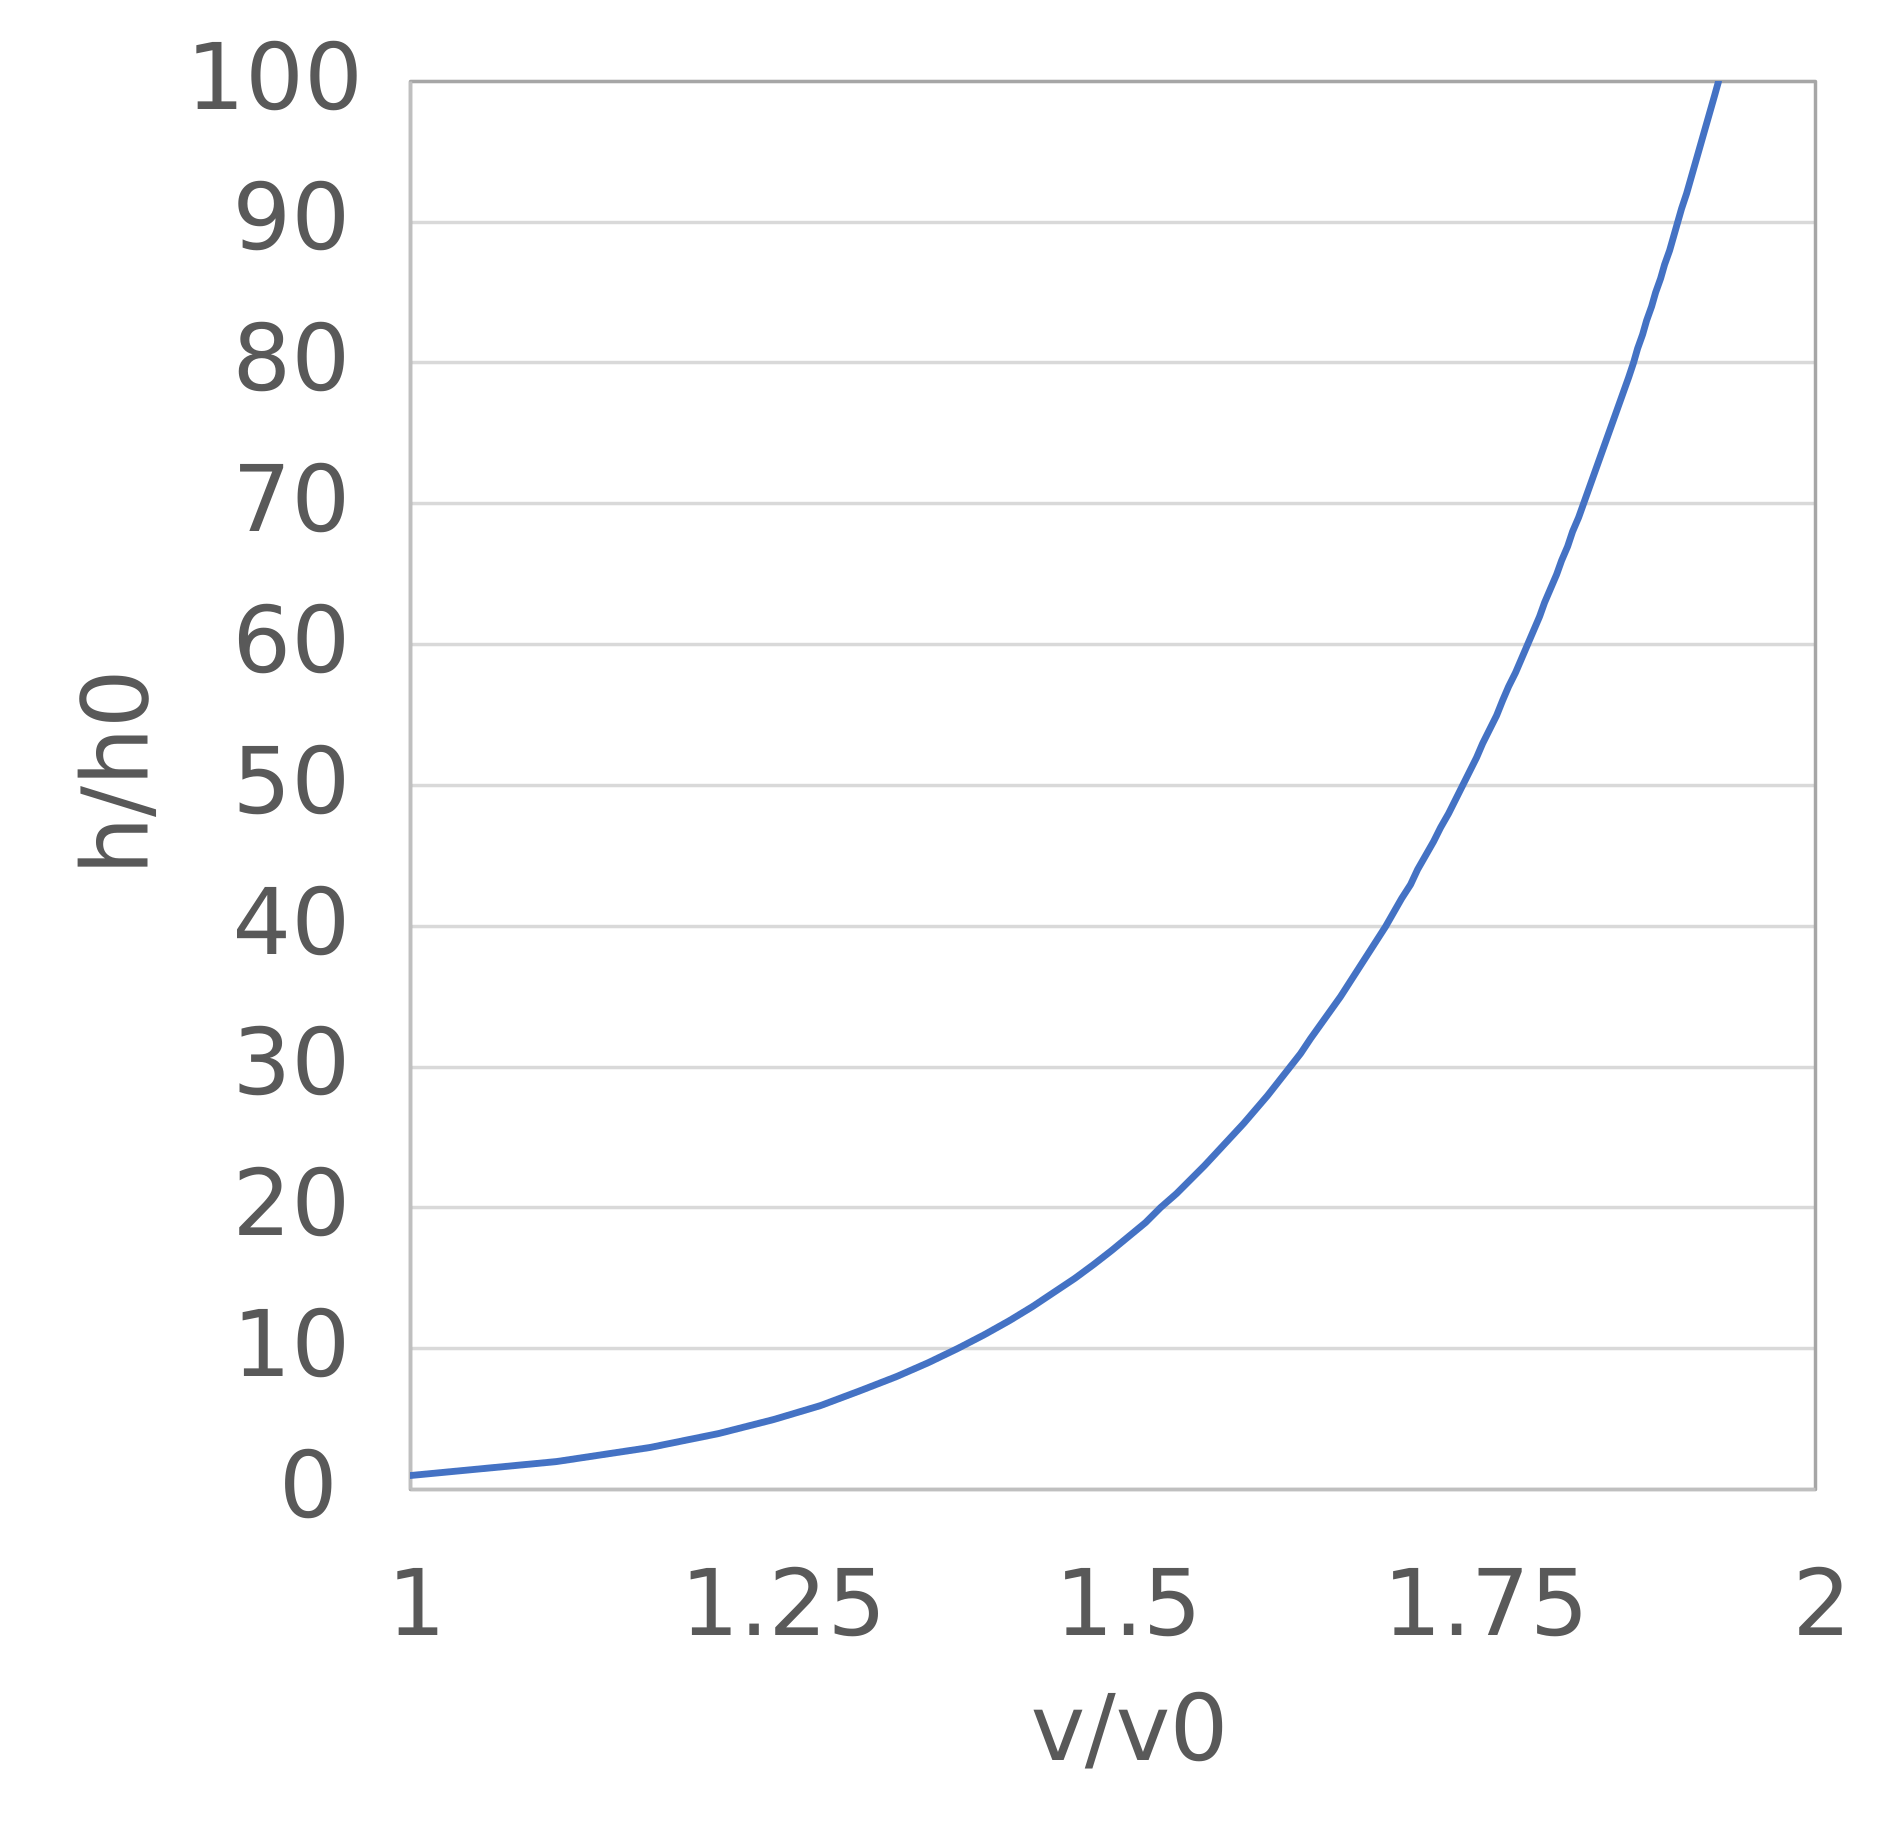
$$v = v_0\left(\frac{h}{h_0}\right)^{1/7}$$
* Hellmann potential
* (and turbine power increases as $v^3$)
:::
::: {.col2-v}
:::
:::
## Wind--ground effects
::: {.cols2}
::: {.col2-vp}
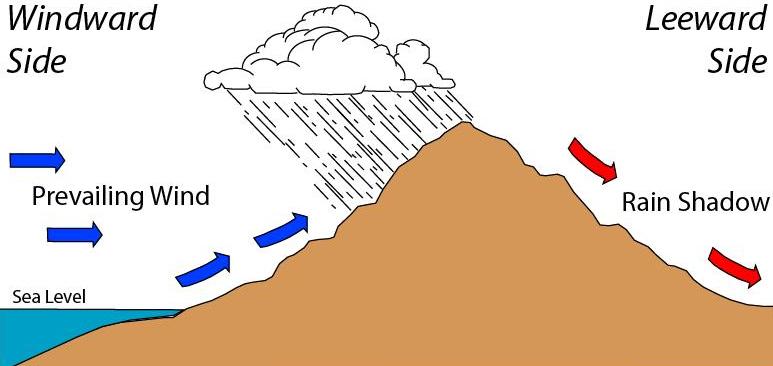
* Mountains
* Valleys
* Land versus water
* Sea/land breezes
* Day/night temperature changes
* Monsoon
* hot land, draws in moist air from oceans
* rises, cools, condense to rain
:::
::: {.col2-v}
[Rain shadow](https://en.wikipedia.org/wiki/Rain_shadow)
:::
:::
## Temperature inversion
::: {.cols2}
::: {.col2-vp}
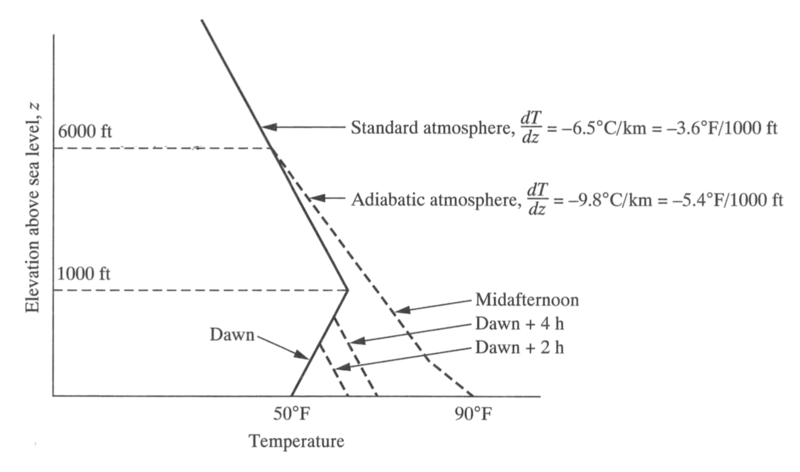
* Daily temperature inversion
* Surface cools at night
* Cools surrounding air
* Slowly reverts during the day
* Inversion $\rightarrow$ stable air
* Morning: hot air balloons
* Afternoon: soaring birds
* updrafts, dust devils
:::
::: {.col2-v}
:::
:::
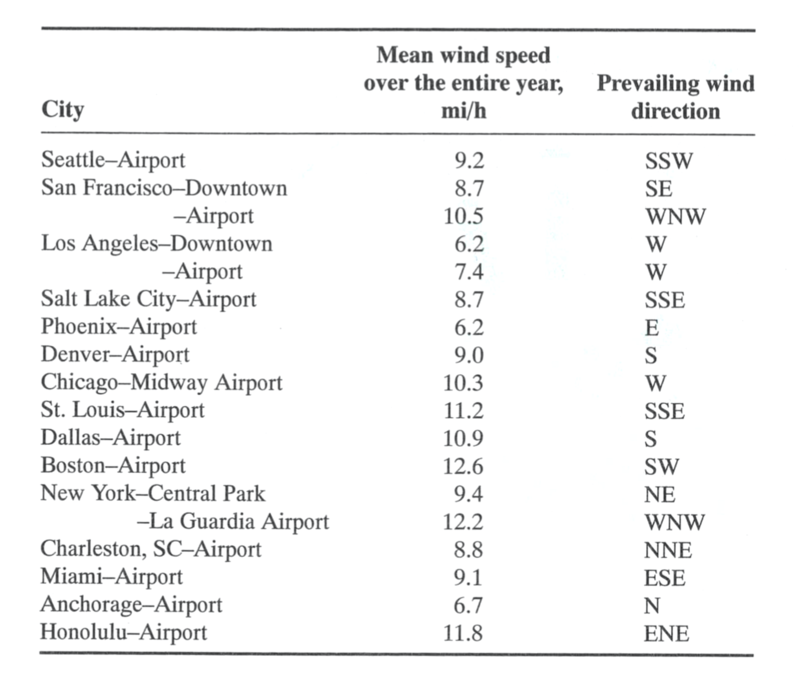
## Typical Wind Speeds ~ 10 mi/h ~ 4.5 m/s
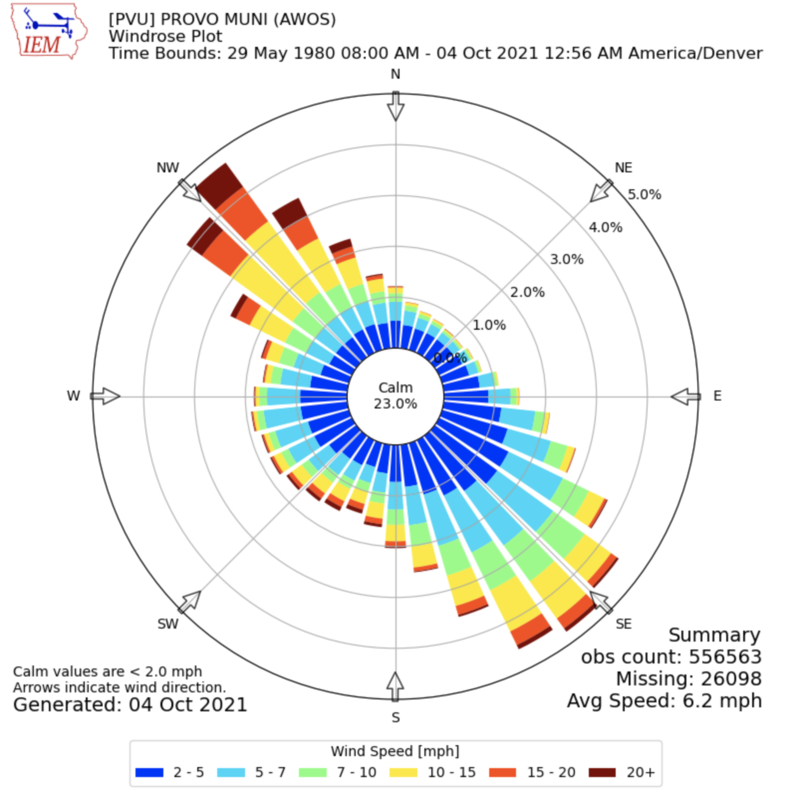
Wind direction is the direction the wind is coming **from**
Wind speed typically measured at a height of 10 m
## Wind Rose
## Wind classification
| Bg | v (m/s) | v (mph) | Designation | Effect |
|----|------------|-----------|-----------------|--------------------------------------------------|
| 0 | 0–0.2 | 0-0.45 | No wind | Smoke rises straight up |
| 1 | 0.3–1.5 | 0.67-3.4 | Light air | Wind direction only detectable from smoke |
| 2 | 1.6–3.3 | 3.6-7.4 | Light breeze | Palpable wind, leaves rustle |
| 3 | 3.4–5.4 | 7.6-12 | Gentle breeze | Leaves and thin twigs move |
| 4 | 5.5–7.9 | 12.3-17.7 | Moderate breeze | Wind moves twigs and thin branches, carries dust |
| 5 | 8.0–10.7 | 17.9-24 | Fresh breeze | Small trees begin to sway |
| 6 | 10.8–13.8 | 24.2-30.9 | Strong breeze | Thick branches move, wind begins to whistle |
| 7 | 13.9–17.1 | 31.1-38.2 | Near gale | Trees in motion, hard to walk |
| 8 | 17.2–20.7 | 38.5-46,3 | Fresh gale | Twigs broken off trees |
| 9 | 20.8–24.4 | 46.5-54.6 | Strong gale | Minor damage to buildings and roofs |
| 10 | 24.5–28.4 | 54.8-63.5 | Whole gale | Trees uprooted |
| 11 | 28.5–32.6 | 63.7-72.9 | Violent storm | Heavy damage |
| 12 | ≥ 32.7 | ≥ 73.1 | Hurricane force | Severe damage |
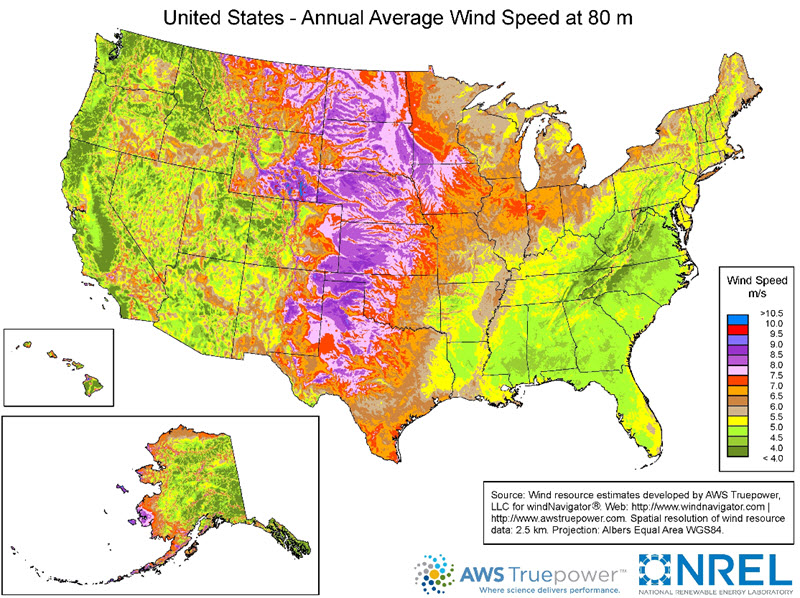
# US wind map
::: notes
* overlay this with where people live
* m/s * 2.2 = mph
:::
## Transmission (article)
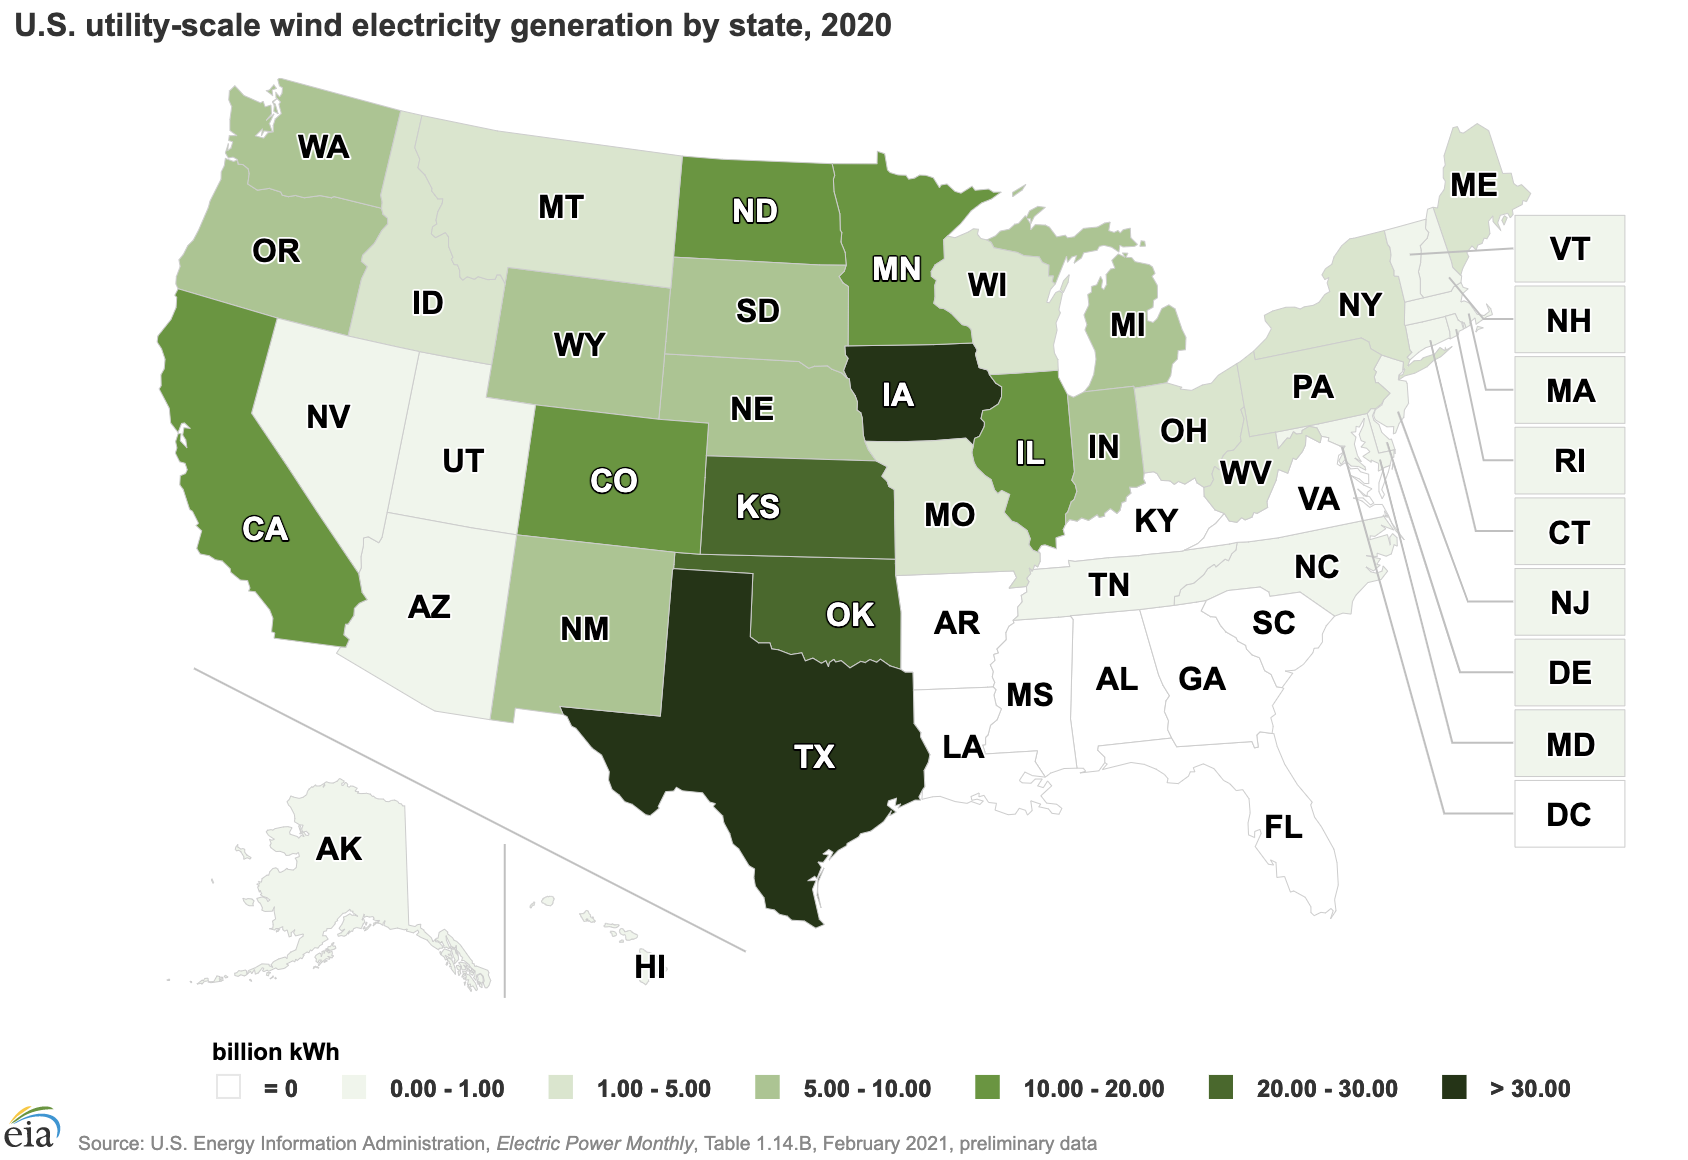
## US wind by state
[Interactive map](https://www.eia.gov/energyexplained/wind/where-wind-power-is-harnessed.php)
## US installed wind capacity by state
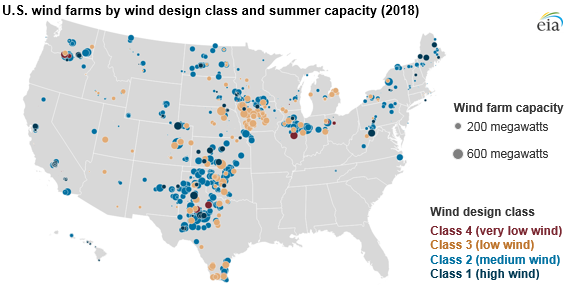
## US wind farms
## World Wind Energy
::: {.cols2}
::: {.col2-v}
Capacity
:::
::: {.col2-v}
Generation
:::
:::
1400 TWh/yr = 160 GW
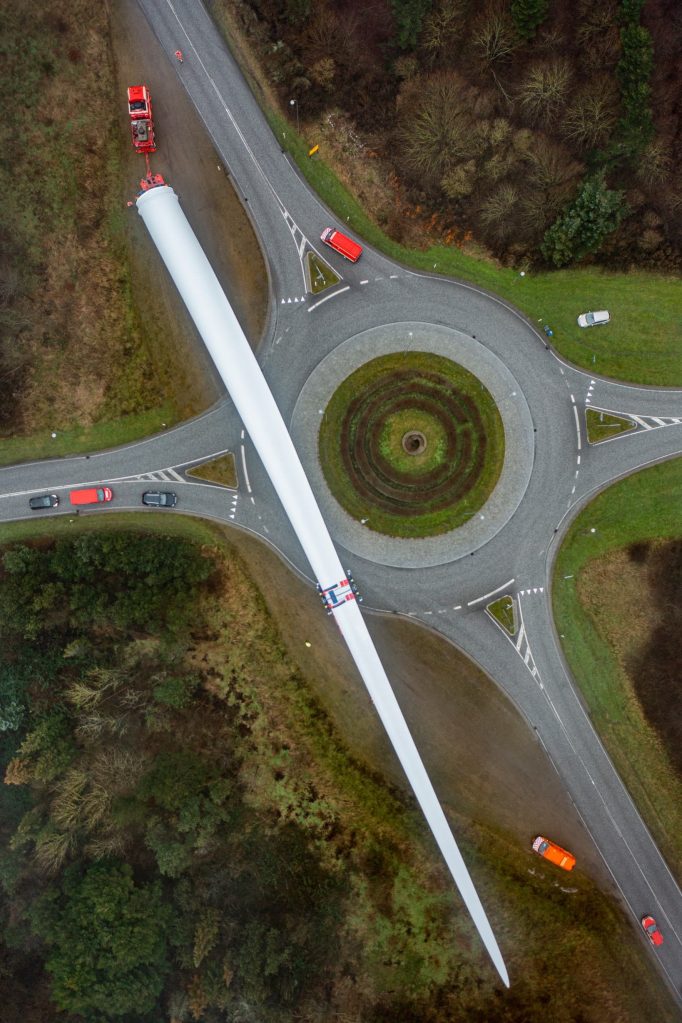
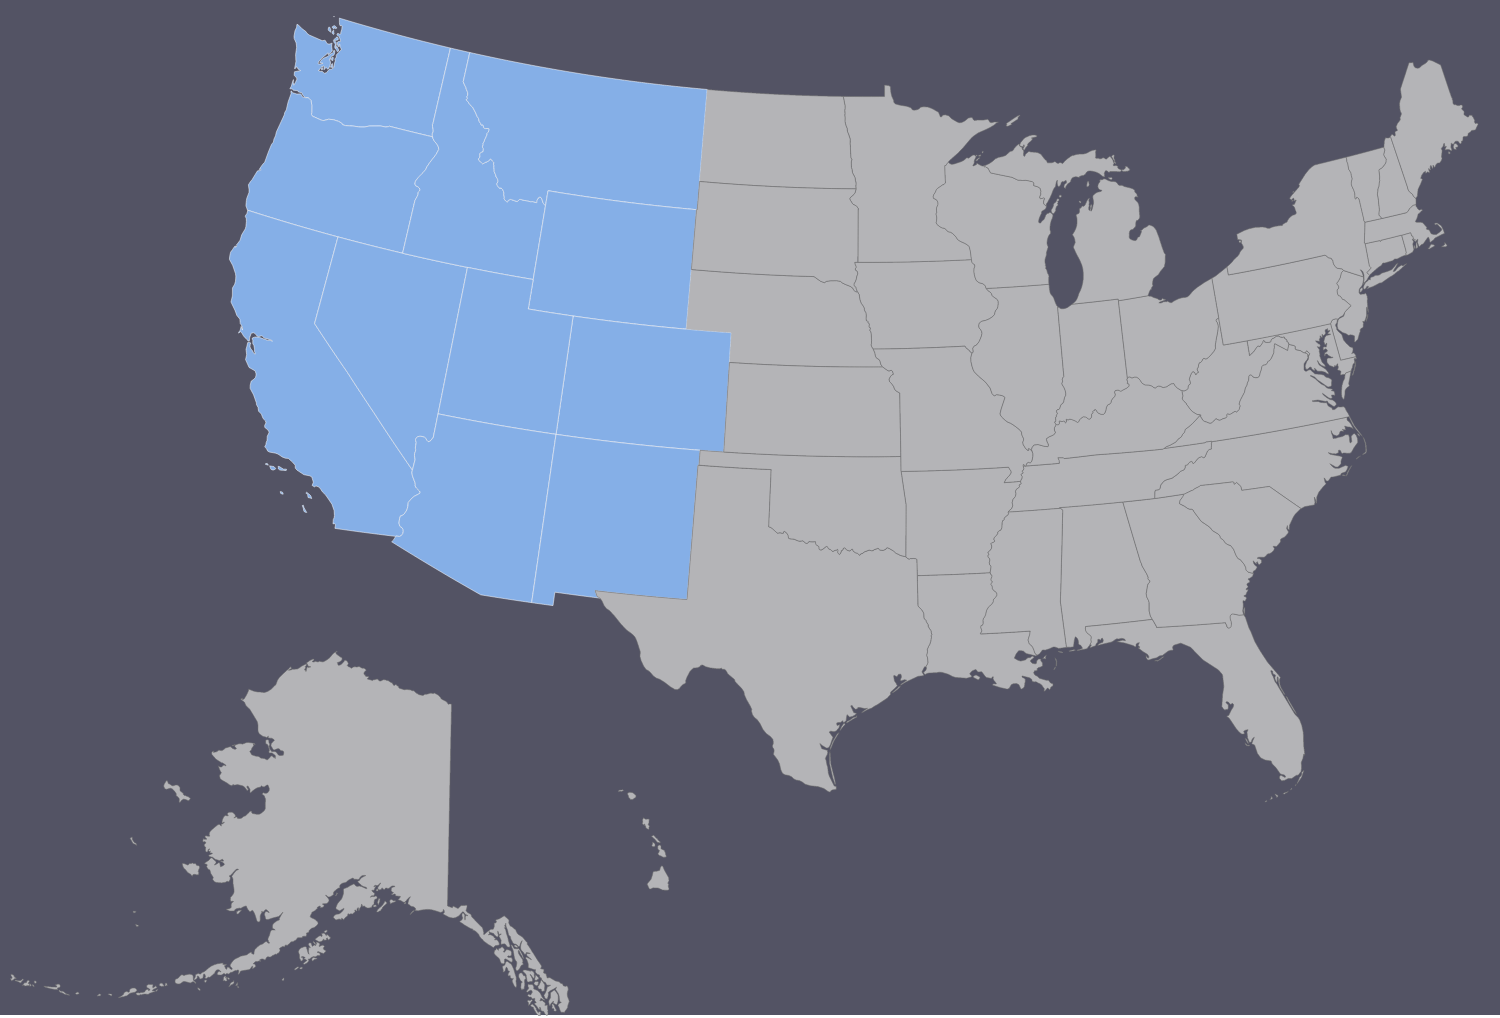
## A sense of scale: 1 CMO of Wind Turbines
:::::: {.columns}
::: {.column}
* 2,478,571 average sized land-based wind turbines
* Build 953 per week for 50 years
* 2 MW (typical)
* 8751 [average size land-based wind farms](https://en.wikipedia.org/wiki/List_of_onshore_wind_farms)
- 566 MW each (the avg size above 250 MW)
- 283 turbines each at 1.65 MW
- Build 5 farms a week for 33 years
* Using a 35% capacity factor.
:::
::: {.column}
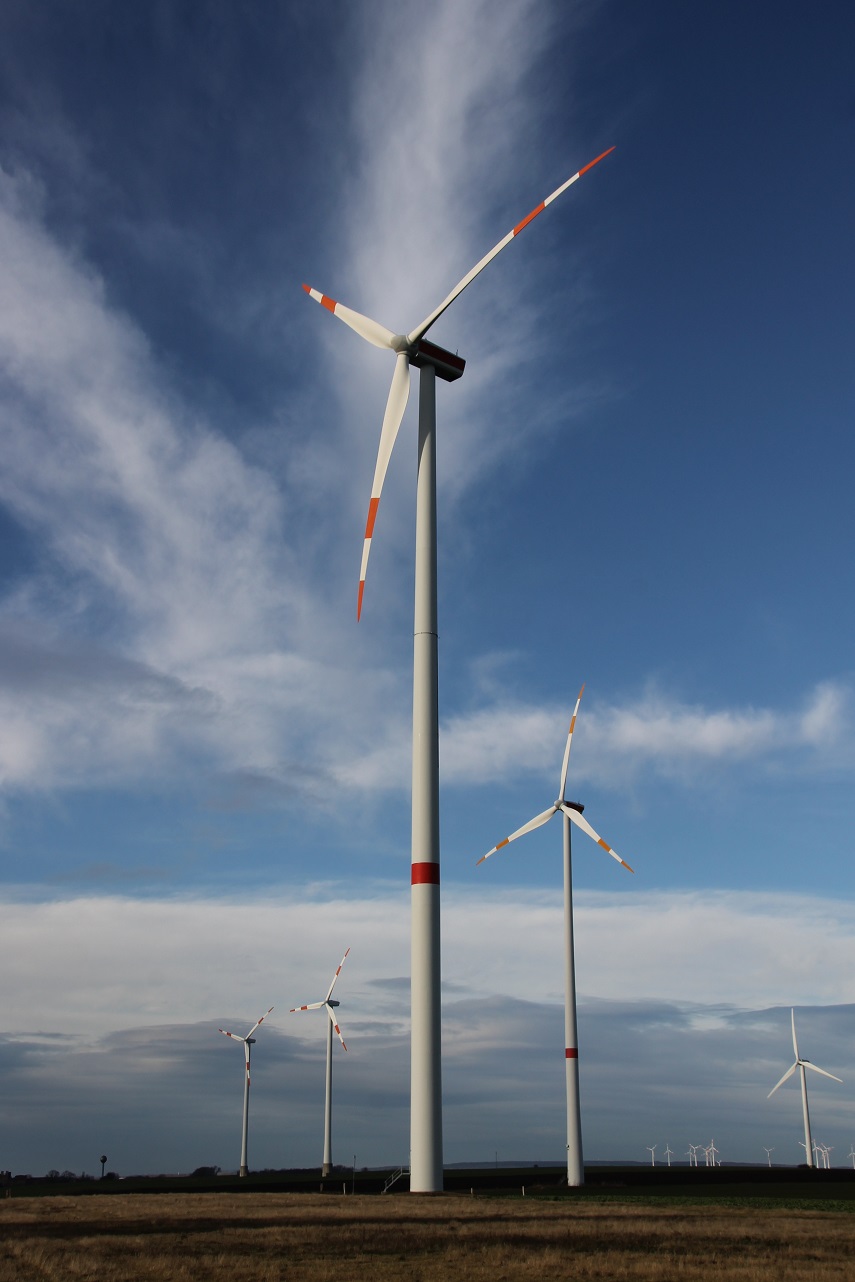
*3 CMO for typical wind farm area*
:::
::::::
# Turbine types
::: {.cols2}
::: {.col2-vp}
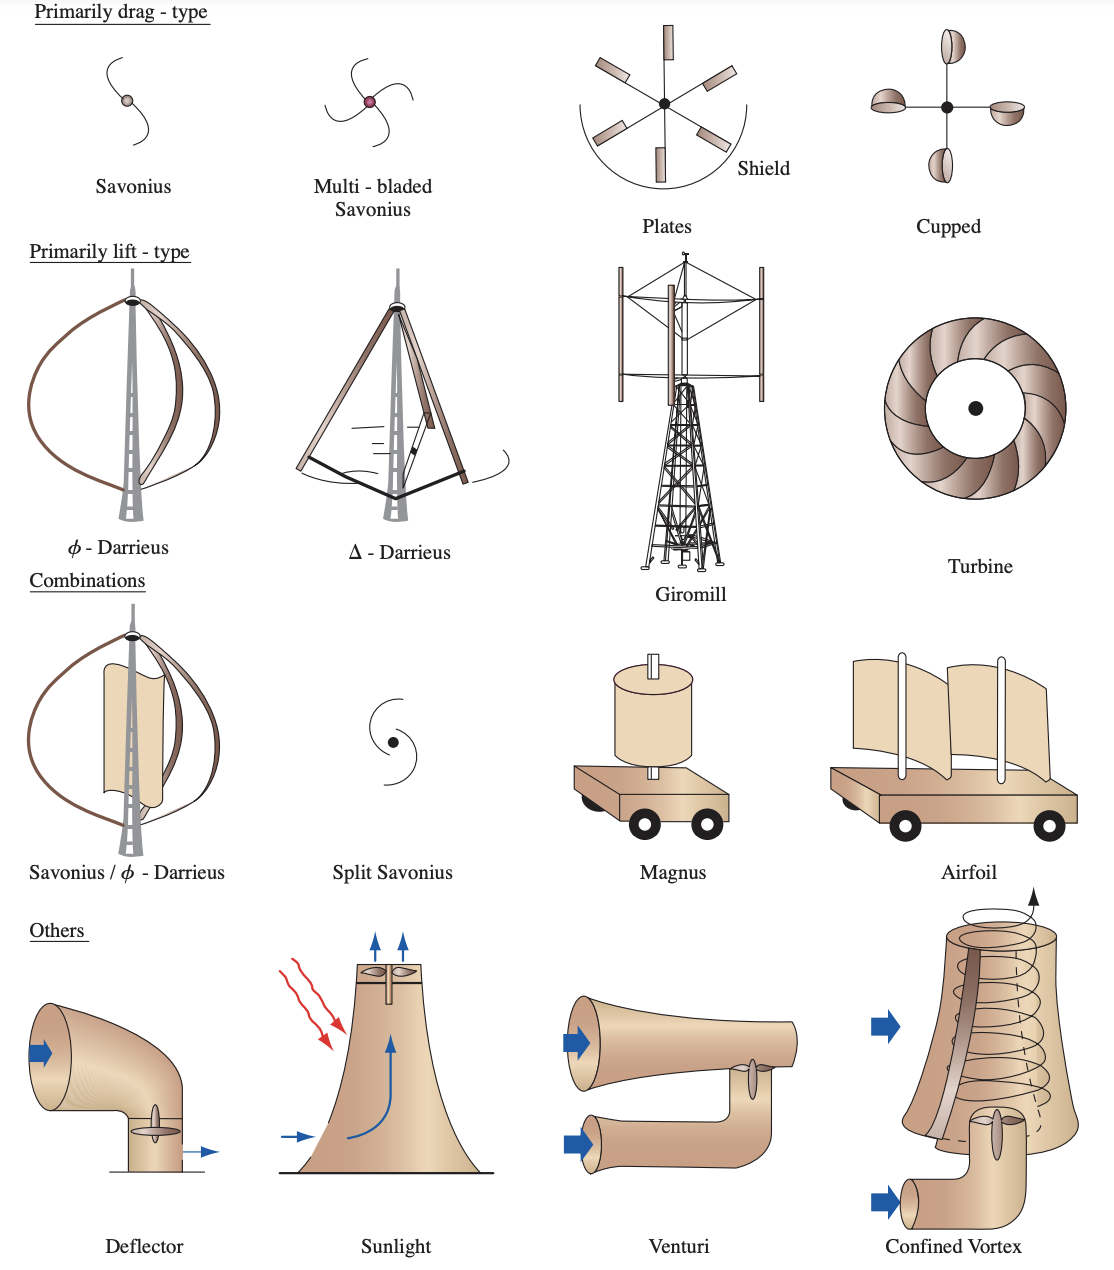
* Drag turbines
* higher drag on one side $\rightarrow$ spin
* simple
* max $C_p=0.19$
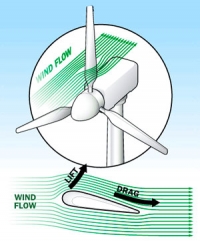
* Lift turbines
* faster speeds
* less material
* higher max $C_p=0.59$
:::
::: {.col2-v}
:::
:::
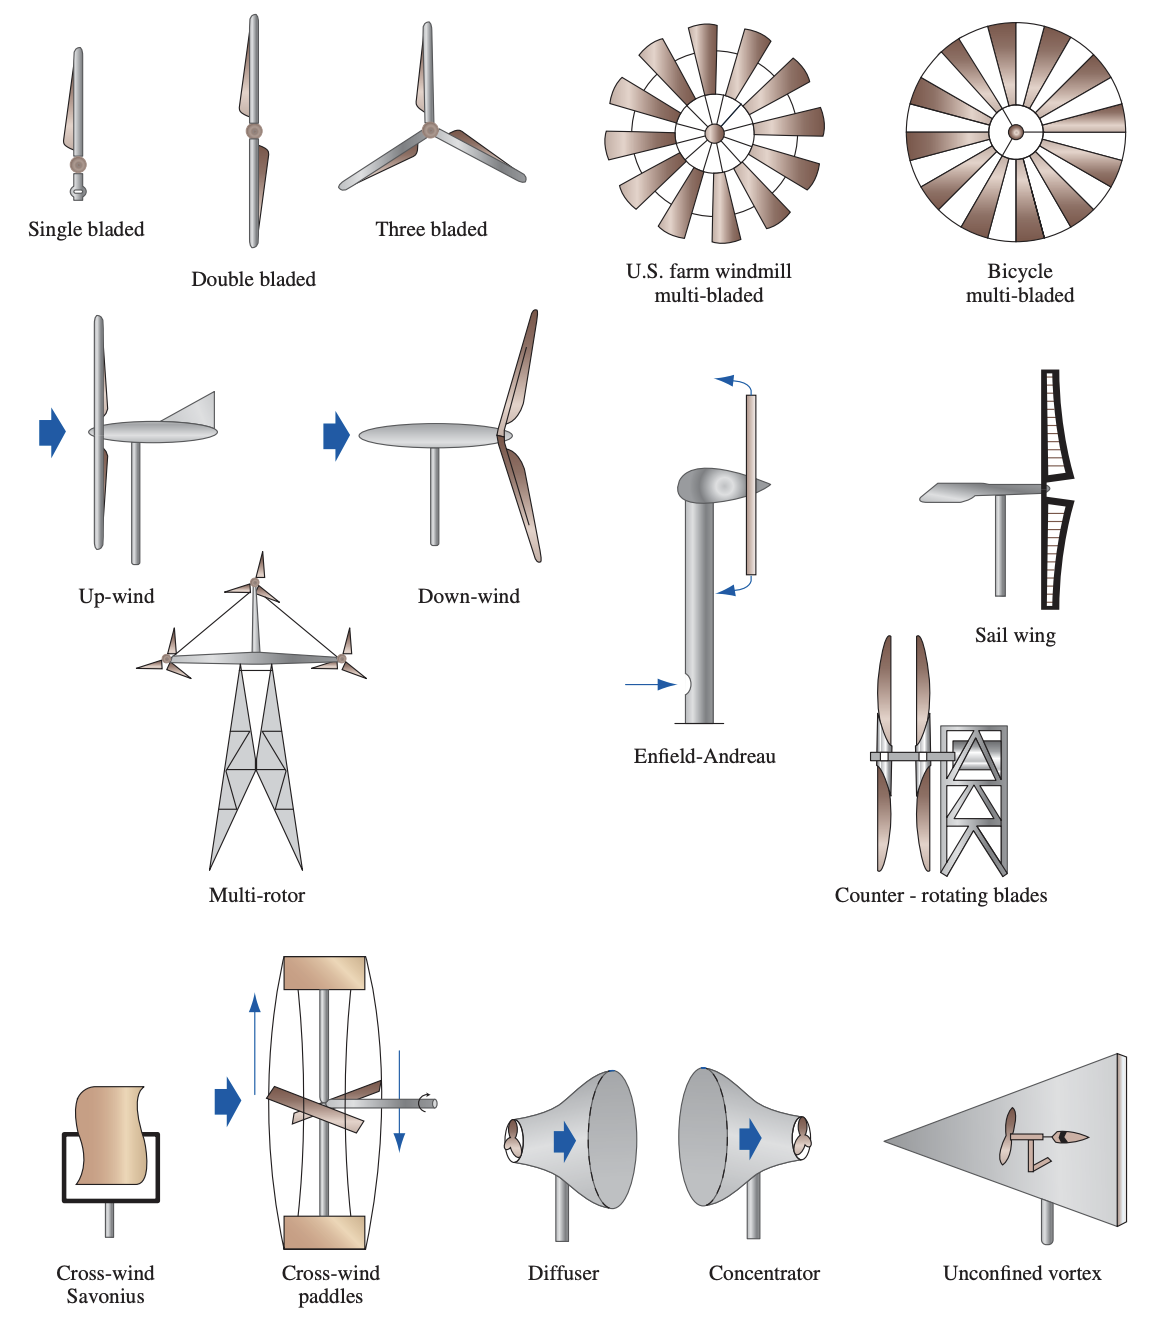
## Turbine types -- HAWT
## Turbine types -- VAWT
## Turbine types -- VAWT
* Benefits
* Relatively simple structures
* generator, gearbox, electrical controls can be stored in the ground station.
* easier to maintain
* do not have to track the wind
* good for regions where the wind direction changes quickly
* Detriments
* Lower efficiency compared to HAWT
* material fatigue due to frequently changing loads.
* more material.
* Used in specialized applications, where certain noted benefits are desired.
## Turbine types -- VAWT
::: {.cols2}
::: {.col2-vp}
* [Savonius](https://en.wikipedia.org/wiki/Savonius_wind_turbine)
* $C_{p,\text{max}}$ = 0.25
* overlap $\rightarrow$ some lift
* startup at low wind speeds $\rightarrow$ ventilation
* material intensive
* used to startup Darrieus rotors
* [Darrieus](https://en.wikipedia.org/wiki/Darrieus_wind_turbine)
* lift turbine.
* blade angle changes in the wind as it rotates
* more efficient than Savonius, 75% as efficient as HAWT.
* not self-starting.
* H-rotor version
* extreme weather conditions, very robust
:::
::: {.col2-v}
:::
:::
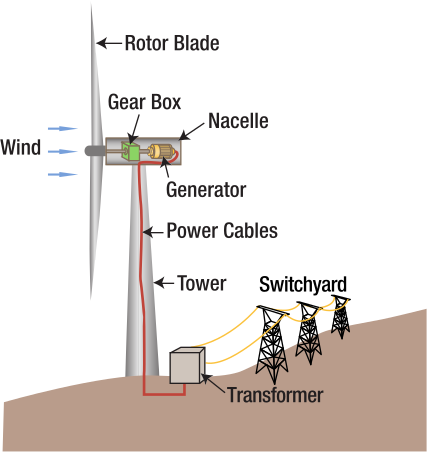
# Turbine components
## Turbine blades
::: {.cols2}
::: {.col2-vp}
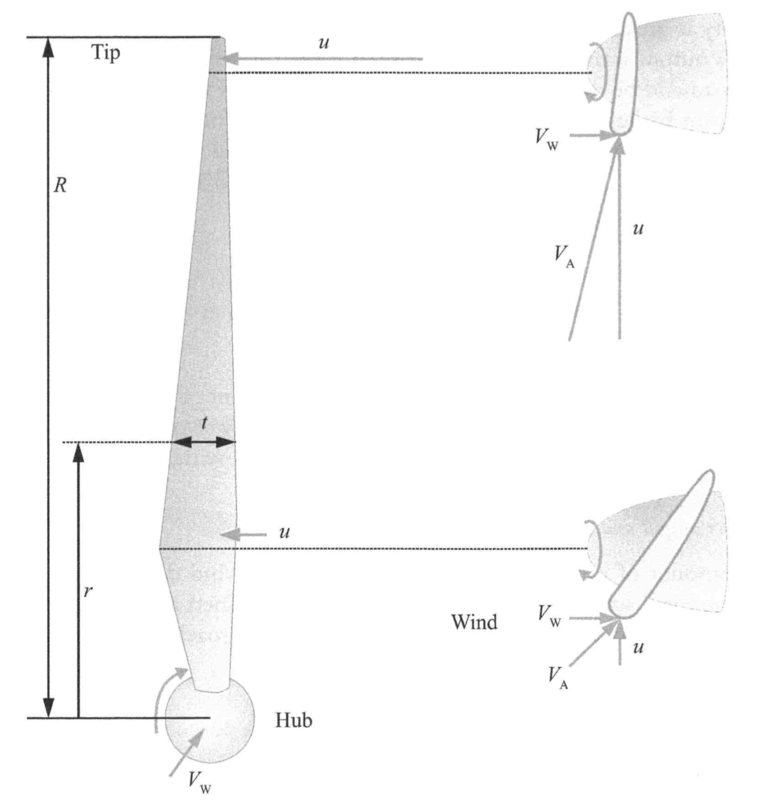
* Wind speed $v_w$, blade speed $u$, $\rightarrow$ relative $v_A$
* blade is angled into $v_A$
* $u$ increases along blade length
* blades twist into changing $v_A$
* Thick near the base for structural support
* [Tapers along length to reduce drag as $u$ $\uparrow$](https://www.newscientist.com/article/dn24250-catch-the-breeze/#:~:text=A%20modern%20blade%20is%20often,at%20the%20faster%20moving%20tip.&text=The%20blades%20extract%20power%20from,turbine%20to%20spill%20around%20it.)
* Made of epoxied fiber glass/carbon fiber
* cheap, lightweight, strong
* [90% of manufacturing costs](https://www.windpowerengineering.com/blade-materials-manufacturing-changing-keep-larger-turbines/#:~:text=Materials%20for%20the%20wind%2Dturbine,%2Dresistant%2C%20and%20dimensionally%20stable.)
* [Edge erosion issues](https://weatherguardwind.com/leading-edge-erosion/)
:::
::: {.col2-v}
:::
:::
::: notes
https://www.lesics.com/working-and-design-detials-of-wind-turbines.html
:::
## Turbine video
## Typical turbine
::: {.cols2}
::: {.col2-vp}
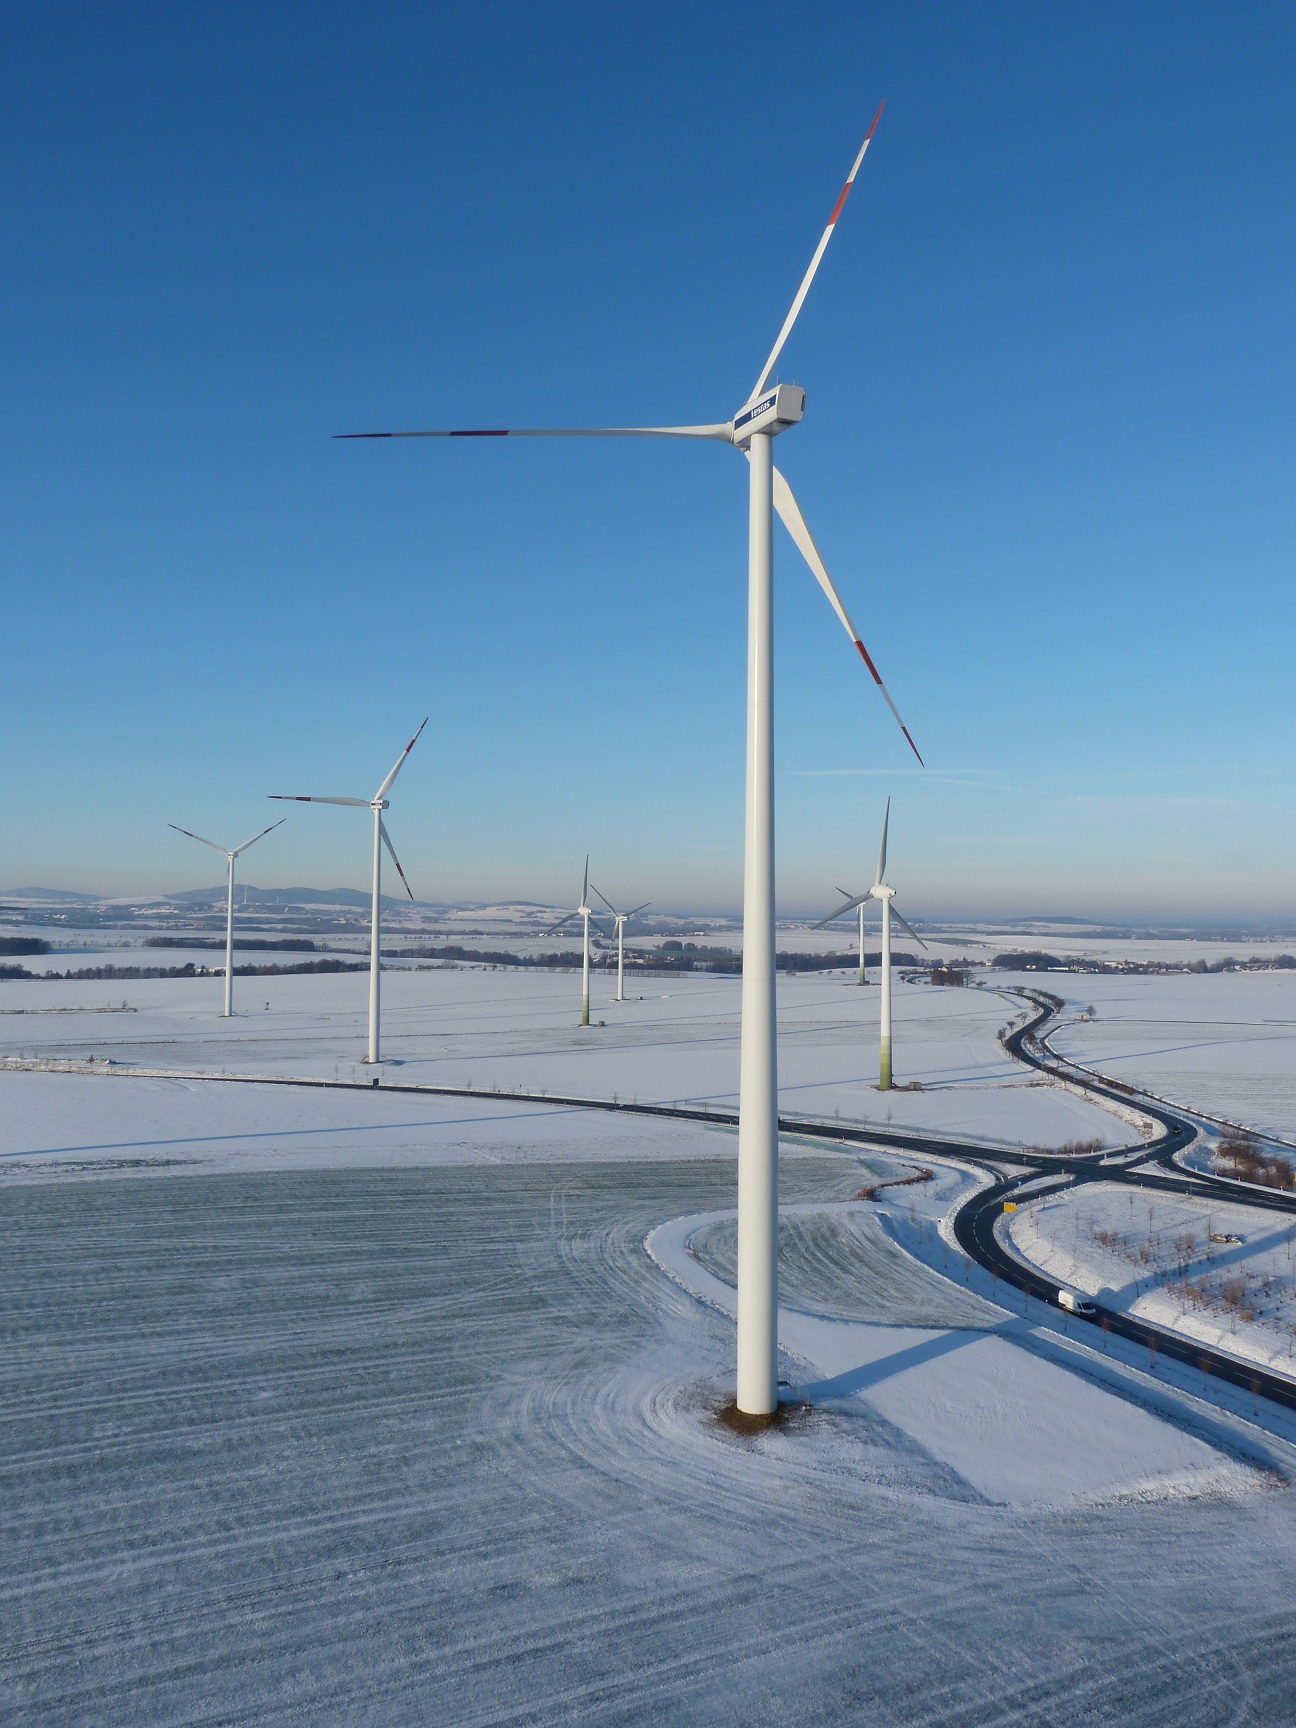
* [Vestas V90](https://www.vestas.com/en/pages/backup-2-mw-platform/V90-2-0-MW)
* 2 MW
* 44 m blades, 90 m rotor diameter
* 6362 m$^2$ swept area
* 80 m tower height
* Noise: 104 dB (~helicopter, lawnmower)
* [43 dB 300 m away](https://www.inspirecleanenergy.com/blog/clean-energy-101/what-is-a-wind-farm)
* wind speeds: 4-25 m/s (9-56 mph)
* [Blade tip speeds](https://www.wind-energy-the-facts.org/tip-speed-trends.html)
* 167 mph for a 90 m diameter turbine
:::
::: {.col2-v}
:::
:::
# Wind turbine analysis
::: {.cols2}
::: {.col2-vp}
* Ideal analysis
* No frictional losses
* Bernoulli equation holds
* one-dimensional flow
* Power is $\dot{m}$ times change in KE
$$\dot{W}= \frac{1}{2}\dot{m}(v_1^2 - v_4^2)$$
* Now, $\dot{m}$ is given by
$$\dot{m}=\rho Av$$
* A is area swept by rotor
* v is the velocity at the rotor
* v is unknown, calculate it
Let $v=v_2=v_3$ with $\dot{m}=\rho Av$. This gives
$$v = \frac{1}{2}(v_1+v_4)$$
Now, power is $\dot{m}$ times change in KE:
$$\dot{W}= \frac{1}{2}\dot{m}(v_1^2 - v_4^2) = \frac{1}{4}\rho A(v_1+v_4)(v_1^2-v_4^2)$$
* Competition: $\dot{m}$, $\Delta KE$
* $\Delta KE \uparrow \text{ with } \downarrow v_4$, but
* $\dot{m} \downarrow \text{ with } \downarrow v_4$
* Find the max power for given wind speed $v_1$.
* Solve for $v_4$ where $d\dot{W}/dv_4=0$.
$$v_{4,\text{max}}=\frac{v_1}{3}$$
* Insert in $\dot{W}$ expression:
$$\dot{W}_\text{max} = \frac{8}{27}\rho Av_1^3$$
$$\dot{W}_\text{max} = \frac{8}{27}\rho Av_1^3$$
The "available" power of the air is
$$\dot{W}_\text{avail} = \frac{1}{2}\dot{m}v_1^2 = \frac{1}{2}\rho Av_1^3$$
$$C_p = \frac{\dot{W}}{\dot{W}_\text{avail}}$$
$$C_{p,\text{max}} = \frac{16}{27} = 0.5926 \text{ is the Betz number}$$
$$\eta = \frac{C_p}{C_{p,\text{max}}}$$
:::
::: {.col2-v}
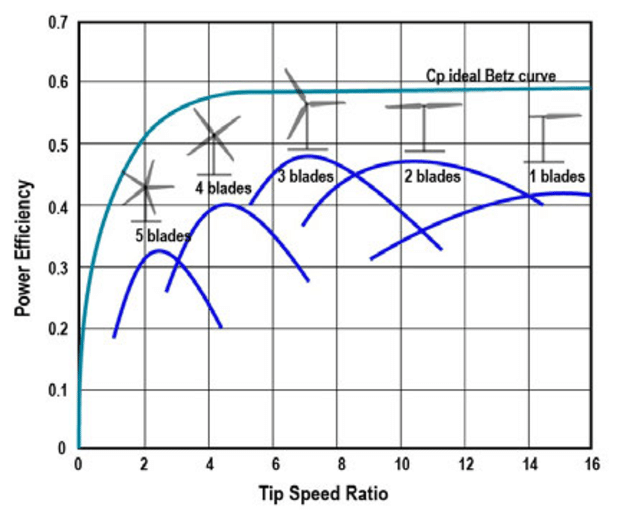
$\omega R/V = \lambda$ is common notation
:::
:::
::: notes
* note the same area used in Wmax and Wavail; power through turbine area vs power in the air of same area at air velocity
:::
# Number of blades
See also: [link](https://interestingengineering.com/the-scientific-reason-why-wind-turbines-have-3-blades).
## Number of blades
## Power curve
# Wind Farms
::: {.cols2}
::: {.col2-vp}
* [Largest](https://en.wikipedia.org/wiki/Gansu_Wind_Farm) (China)
* 20 GW planned (8 current)
* \$17.5 billion
* 7000 turbines
* [Turbines spaced ~7 rotor diameters apart](https://energyfollower.com/wind-turbine-spacing/)
* 80 m $\rightarrow$ 1/3 mile apart
* [Turbine arrays: square, fan, etc.](https://knowablemagazine.org/article/sustainability/2017/bumpy-air-boosts-wind-power)
* [Article 1, Prof. Ning (BYU)](https://scholarsarchive.byu.edu/cgi/viewcontent.cgi?article=5517&context=facpub)
* [Article 2, Prof. Ning (BYU)](https://onlinelibrary.wiley.com/doi/pdf/10.1002/we.1993)
* Wake issues, rotation
* Cost: [$3-4 million installed](https://williamkamkwamba.com/how-much-wind-turbine-costs/) for a 2 MW turbine
:::
::: {.col2-v}
*San Gorgonio Pass, CA*
:::
:::
## Wind farm simulation
## Wind farm fog
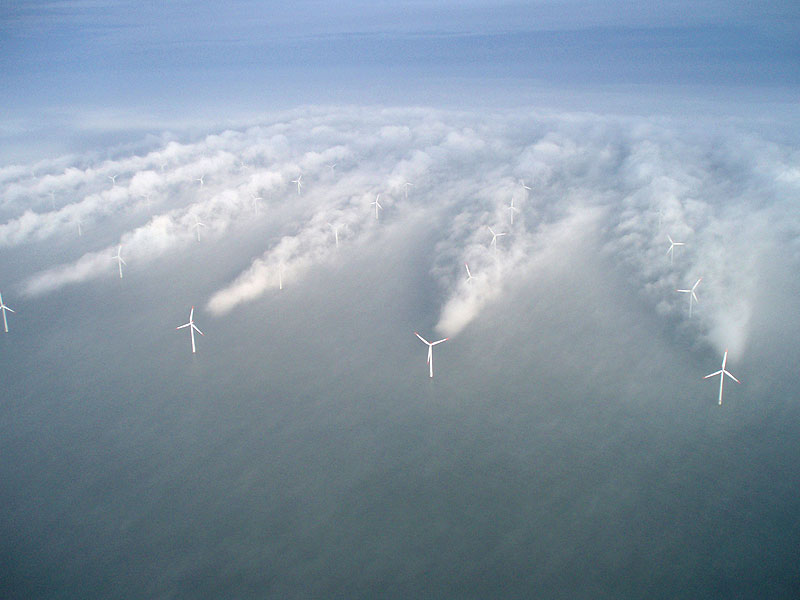
> Wake turbulence behind individual wind turbines can be seen in the fog in this aerial photo of the Horns Rev wind farm off the Western coast of Denmark. Data collected from wind farms such as this one provide validation to simulation models.
:max_bytes(150000):strip_icc():format(webp)/birds-2a1eb844b9f54124aa88a5d3e2719bf4.jpeg "https://www.treehugger.com/thmb/ZZW_zBp22YywXY7di0q7SCBZCD4=/1250x0/filters:no_upscale():max_bytes(150000):strip_icc():format(webp)/birds-2a1eb844b9f54124aa88a5d3e2719bf4.jpeg") :::
:::
 :::
:::
## Wind--Coriolis
::: {.cols2}
::: {.col2-v}
:::
:::
## Wind--Coriolis
::: {.cols2}
::: {.col2-v}
 :::
::: {.col2-v}
:::
::: {.col2-v}
 :::
:::
## Wind--ground effects
::: {.cols2}
::: {.col2-vp}
* Mountains
* Valleys
* Land versus water
* Sea/land breezes
* Day/night temperature changes
* Monsoon
* hot land, draws in moist air from oceans
* rises, cools, condense to rain
:::
::: {.col2-v}
[Rain shadow](https://en.wikipedia.org/wiki/Rain_shadow)
:::
:::
## Wind--ground effects
::: {.cols2}
::: {.col2-vp}
* Mountains
* Valleys
* Land versus water
* Sea/land breezes
* Day/night temperature changes
* Monsoon
* hot land, draws in moist air from oceans
* rises, cools, condense to rain
:::
::: {.col2-v}
[Rain shadow](https://en.wikipedia.org/wiki/Rain_shadow)
 :::
:::
## Temperature inversion
::: {.cols2}
::: {.col2-vp}
* Daily temperature inversion
* Surface cools at night
* Cools surrounding air
* Slowly reverts during the day
* Inversion $\rightarrow$ stable air
* Morning: hot air balloons
* Afternoon: soaring birds
* updrafts, dust devils
:::
::: {.col2-v}
:::
:::
## Temperature inversion
::: {.cols2}
::: {.col2-vp}
* Daily temperature inversion
* Surface cools at night
* Cools surrounding air
* Slowly reverts during the day
* Inversion $\rightarrow$ stable air
* Morning: hot air balloons
* Afternoon: soaring birds
* updrafts, dust devils
:::
::: {.col2-v}
 :::
:::
## Typical Wind Speeds ~ 10 mi/h ~ 4.5 m/s
:::
:::
## Typical Wind Speeds ~ 10 mi/h ~ 4.5 m/s
 Wind direction is the direction the wind is coming **from**
Wind speed typically measured at a height of 10 m
## Wind Rose
Wind direction is the direction the wind is coming **from**
Wind speed typically measured at a height of 10 m
## Wind Rose
 ## Wind classification
 ::: notes
* overlay this with where people live
* m/s * 2.2 = mph
:::
## Transmission (article)
## US wind by state
::: notes
* overlay this with where people live
* m/s * 2.2 = mph
:::
## Transmission (article)
## US wind by state
 [Interactive map](https://www.eia.gov/energyexplained/wind/where-wind-power-is-harnessed.php)
## US installed wind capacity by state
[Interactive map](https://www.eia.gov/energyexplained/wind/where-wind-power-is-harnessed.php)
## US installed wind capacity by state
 ## US wind farms
 ## World Wind Energy
::: {.cols2}
::: {.col2-v}
Capacity
:::
::: {.col2-v}
Generation
:::
:::
## World Wind Energy
::: {.cols2}
::: {.col2-v}
Capacity
:::
::: {.col2-v}
Generation
:::
:::

 1400 TWh/yr = 160 GW
## A sense of scale: 1 CMO of Wind Turbines
:::::: {.columns}
::: {.column}
* 2,478,571 average sized land-based wind turbines
* Build 953 per week for 50 years
* 2 MW (typical)
* 8751 [average size land-based wind farms](https://en.wikipedia.org/wiki/List_of_onshore_wind_farms)
- 566 MW each (the avg size above 250 MW)
- 283 turbines each at 1.65 MW
- Build 5 farms a week for 33 years
* Using a 35% capacity factor.
:::
::: {.column}
1400 TWh/yr = 160 GW
## A sense of scale: 1 CMO of Wind Turbines
:::::: {.columns}
::: {.column}
* 2,478,571 average sized land-based wind turbines
* Build 953 per week for 50 years
* 2 MW (typical)
* 8751 [average size land-based wind farms](https://en.wikipedia.org/wiki/List_of_onshore_wind_farms)
- 566 MW each (the avg size above 250 MW)
- 283 turbines each at 1.65 MW
- Build 5 farms a week for 33 years
* Using a 35% capacity factor.
:::
::: {.column}
 *3 CMO for typical wind farm area*
:::
::::::
# Turbine types
::: {.cols2}
::: {.col2-vp}
* Drag turbines
* higher drag on one side $\rightarrow$ spin
* simple
* max $C_p=0.19$
* Lift turbines
* faster speeds
* less material
* higher max $C_p=0.59$
:::
::: {.col2-v}
*3 CMO for typical wind farm area*
:::
::::::
# Turbine types
::: {.cols2}
::: {.col2-vp}
* Drag turbines
* higher drag on one side $\rightarrow$ spin
* simple
* max $C_p=0.19$
* Lift turbines
* faster speeds
* less material
* higher max $C_p=0.59$
:::
::: {.col2-v}

 :::
:::
## Turbine types -- HAWT
:::
:::
## Turbine types -- HAWT
 :::
:::
# Turbine components
:::
:::
# Turbine components
 ## Turbine blades
::: {.cols2}
::: {.col2-vp}
## Turbine blades
::: {.cols2}
::: {.col2-vp}
 :::
:::
::: notes
https://www.lesics.com/working-and-design-detials-of-wind-turbines.html
:::
## Turbine video
## Typical turbine
::: {.cols2}
::: {.col2-vp}
* [Vestas V90](https://www.vestas.com/en/pages/backup-2-mw-platform/V90-2-0-MW)
* 2 MW
* 44 m blades, 90 m rotor diameter
* 6362 m$^2$ swept area
* 80 m tower height
* Noise: 104 dB (~helicopter, lawnmower)
* [43 dB 300 m away](https://www.inspirecleanenergy.com/blog/clean-energy-101/what-is-a-wind-farm)
* wind speeds: 4-25 m/s (9-56 mph)
* [Blade tip speeds](https://www.wind-energy-the-facts.org/tip-speed-trends.html)
* 167 mph for a 90 m diameter turbine
:::
::: {.col2-v}
:::
:::
::: notes
https://www.lesics.com/working-and-design-detials-of-wind-turbines.html
:::
## Turbine video
## Typical turbine
::: {.cols2}
::: {.col2-vp}
* [Vestas V90](https://www.vestas.com/en/pages/backup-2-mw-platform/V90-2-0-MW)
* 2 MW
* 44 m blades, 90 m rotor diameter
* 6362 m$^2$ swept area
* 80 m tower height
* Noise: 104 dB (~helicopter, lawnmower)
* [43 dB 300 m away](https://www.inspirecleanenergy.com/blog/clean-energy-101/what-is-a-wind-farm)
* wind speeds: 4-25 m/s (9-56 mph)
* [Blade tip speeds](https://www.wind-energy-the-facts.org/tip-speed-trends.html)
* 167 mph for a 90 m diameter turbine
:::
::: {.col2-v}
 :::
:::
# Wind turbine analysis
::: {.cols2}
::: {.col2-vp}
:::
:::
# Wind turbine analysis
::: {.cols2}
::: {.col2-vp}
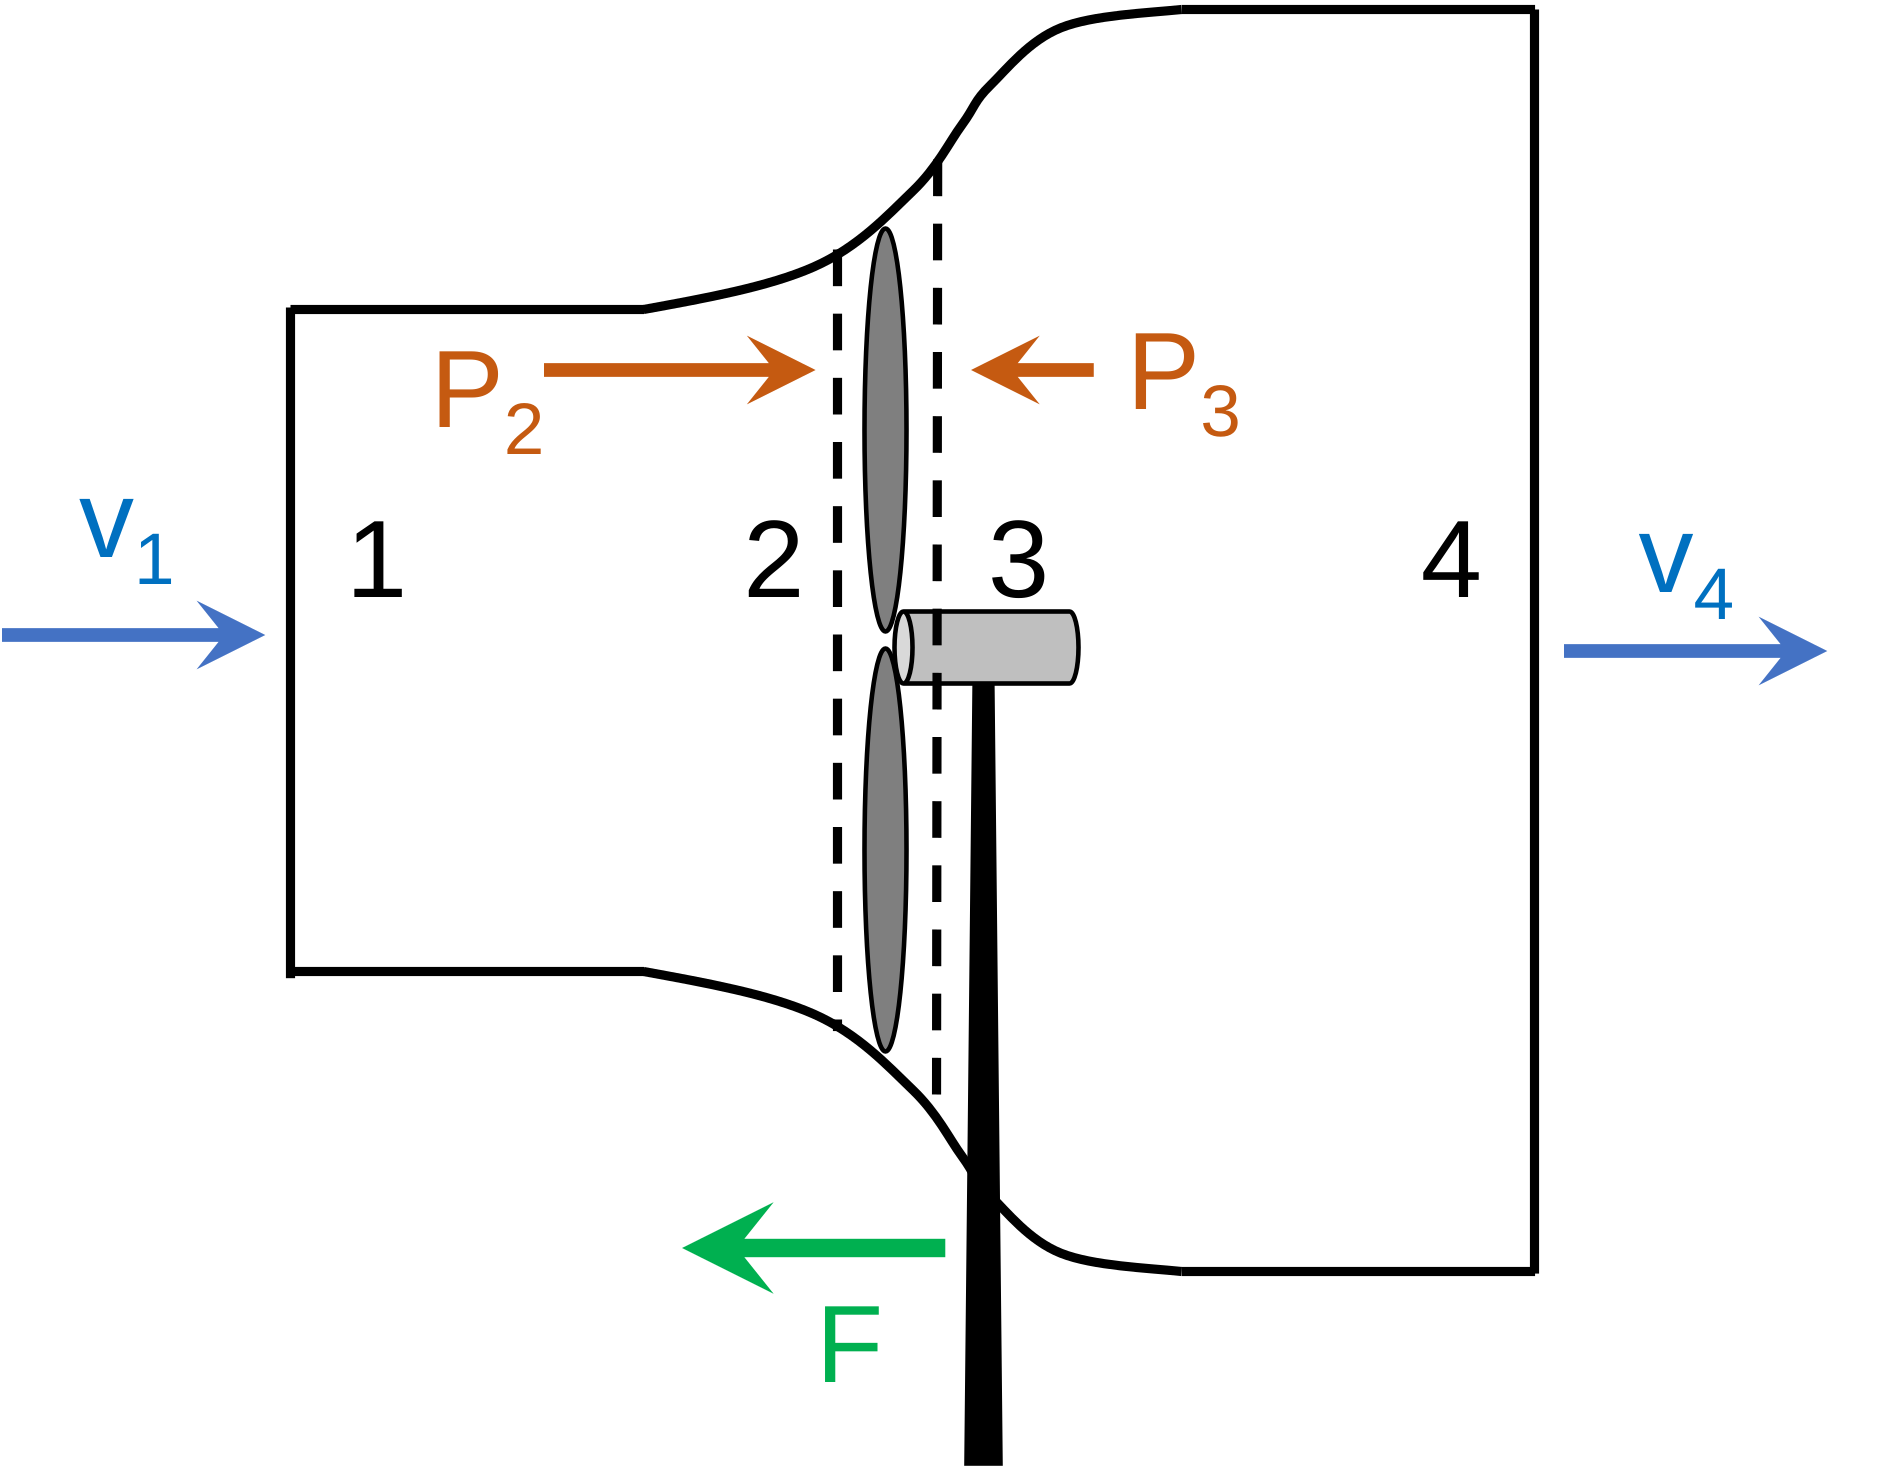 $A$ = circular area swept by the rotor
:::
:::
## Wind turbine analysis
::: {.cols2}
::: {.col2-vp}
Momentum balance: 1 $\leftrightarrow$ 4
$$\cancel{\dot{\text{accum}}} = \dot{\text{in}} + \dot{\text{out}} + \dot{\text{gen}}$$
$$0 = \dot{m}v_1 - \dot{m}v_4 - F$$
Momentum balance: 2 $\leftrightarrow$ 3
$$0 = \cancelto{\,0,\,v_2=v_3}{\dot{m}v_2 - \dot{m}v_3} +P_2A-P_3A - F$$
Combine these:
$$\dot{m}(v_1-v_4) = A(P_2-P_3) = F$$
:::
::: {.col2-v}
$A$ = circular area swept by the rotor
:::
:::
## Wind turbine analysis
::: {.cols2}
::: {.col2-vp}
Momentum balance: 1 $\leftrightarrow$ 4
$$\cancel{\dot{\text{accum}}} = \dot{\text{in}} + \dot{\text{out}} + \dot{\text{gen}}$$
$$0 = \dot{m}v_1 - \dot{m}v_4 - F$$
Momentum balance: 2 $\leftrightarrow$ 3
$$0 = \cancelto{\,0,\,v_2=v_3}{\dot{m}v_2 - \dot{m}v_3} +P_2A-P_3A - F$$
Combine these:
$$\dot{m}(v_1-v_4) = A(P_2-P_3) = F$$
:::
::: {.col2-v}
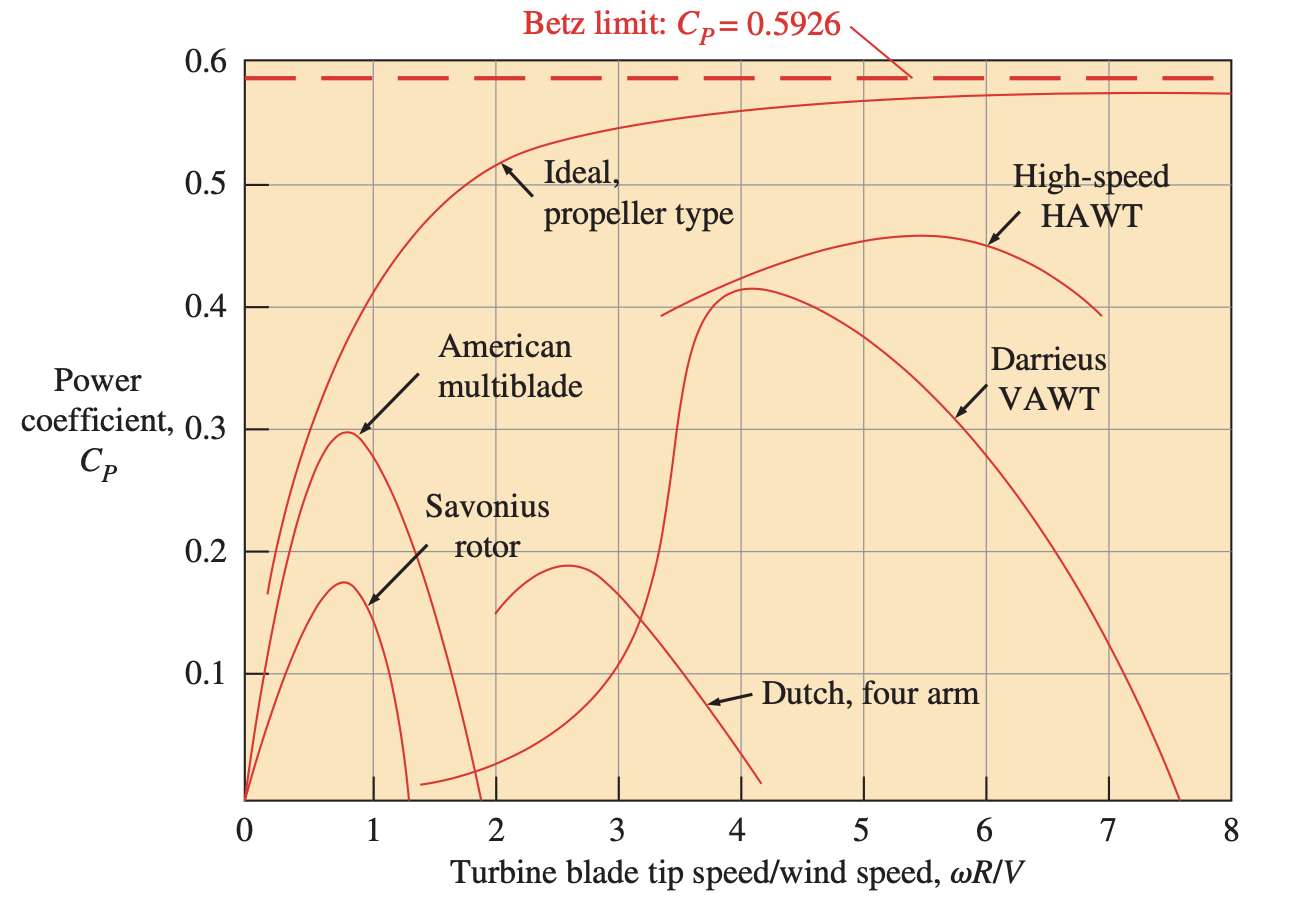 $\omega R/V = \lambda$ is common notation
:::
:::
::: notes
* note the same area used in Wmax and Wavail; power through turbine area vs power in the air of same area at air velocity
:::
# Number of blades
See also: [link](https://interestingengineering.com/the-scientific-reason-why-wind-turbines-have-3-blades).
## Number of blades
$\omega R/V = \lambda$ is common notation
:::
:::
::: notes
* note the same area used in Wmax and Wavail; power through turbine area vs power in the air of same area at air velocity
:::
# Number of blades
See also: [link](https://interestingengineering.com/the-scientific-reason-why-wind-turbines-have-3-blades).
## Number of blades
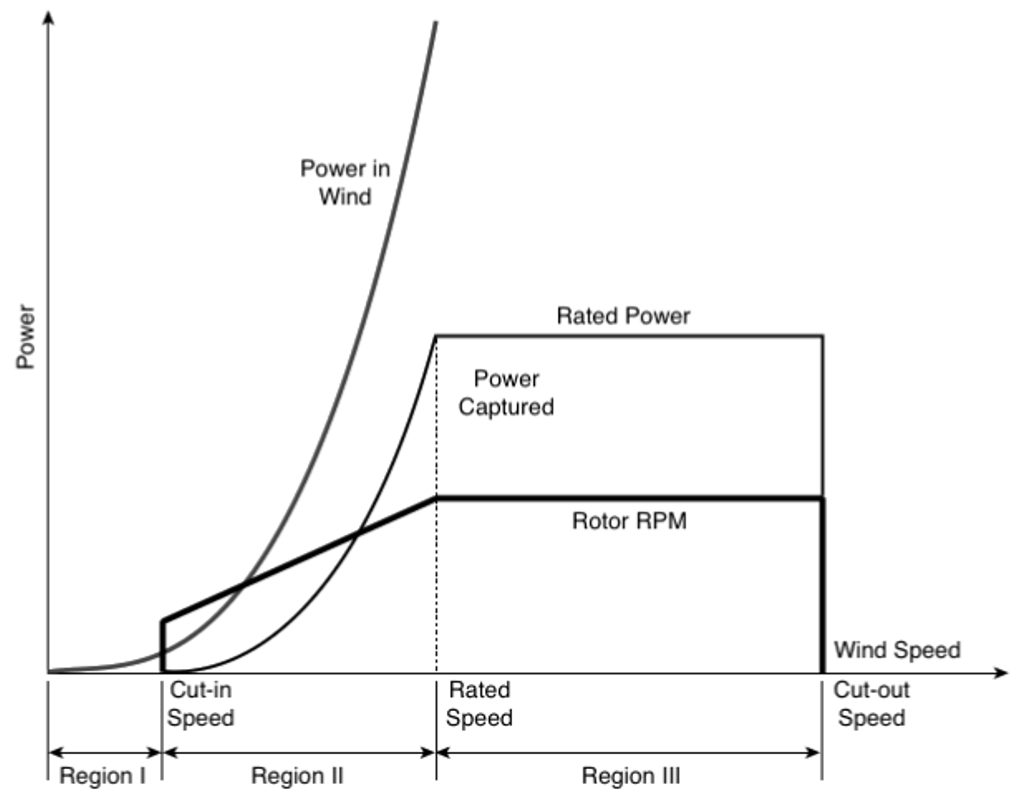
 ## Power curve
 # Wind Farms
::: {.cols2}
::: {.col2-vp}
* [Largest](https://en.wikipedia.org/wiki/Gansu_Wind_Farm) (China)
* 20 GW planned (8 current)
* \$17.5 billion
* 7000 turbines
* [Turbines spaced ~7 rotor diameters apart](https://energyfollower.com/wind-turbine-spacing/)
* 80 m $\rightarrow$ 1/3 mile apart
* [Turbine arrays: square, fan, etc.](https://knowablemagazine.org/article/sustainability/2017/bumpy-air-boosts-wind-power)
* [Article 1, Prof. Ning (BYU)](https://scholarsarchive.byu.edu/cgi/viewcontent.cgi?article=5517&context=facpub)
* [Article 2, Prof. Ning (BYU)](https://onlinelibrary.wiley.com/doi/pdf/10.1002/we.1993)
* Wake issues, rotation
* Cost: [$3-4 million installed](https://williamkamkwamba.com/how-much-wind-turbine-costs/) for a 2 MW turbine
:::
::: {.col2-v}
# Wind Farms
::: {.cols2}
::: {.col2-vp}
* [Largest](https://en.wikipedia.org/wiki/Gansu_Wind_Farm) (China)
* 20 GW planned (8 current)
* \$17.5 billion
* 7000 turbines
* [Turbines spaced ~7 rotor diameters apart](https://energyfollower.com/wind-turbine-spacing/)
* 80 m $\rightarrow$ 1/3 mile apart
* [Turbine arrays: square, fan, etc.](https://knowablemagazine.org/article/sustainability/2017/bumpy-air-boosts-wind-power)
* [Article 1, Prof. Ning (BYU)](https://scholarsarchive.byu.edu/cgi/viewcontent.cgi?article=5517&context=facpub)
* [Article 2, Prof. Ning (BYU)](https://onlinelibrary.wiley.com/doi/pdf/10.1002/we.1993)
* Wake issues, rotation
* Cost: [$3-4 million installed](https://williamkamkwamba.com/how-much-wind-turbine-costs/) for a 2 MW turbine
:::
::: {.col2-v}