ChEn 433 Climate
Class 4
Greenhouse gases
- References and discussion
- CO\(_2\)
- Not a pollutant in the usual sense.
- Becomes such after prolonged emission on a massive scale, and through its effect on climate change
- CH\(_4\)
- N\(_2\)O
- HFCs
- PFCs
- SF\(_6\)
- NF\(_3\)

CO\(_2\)
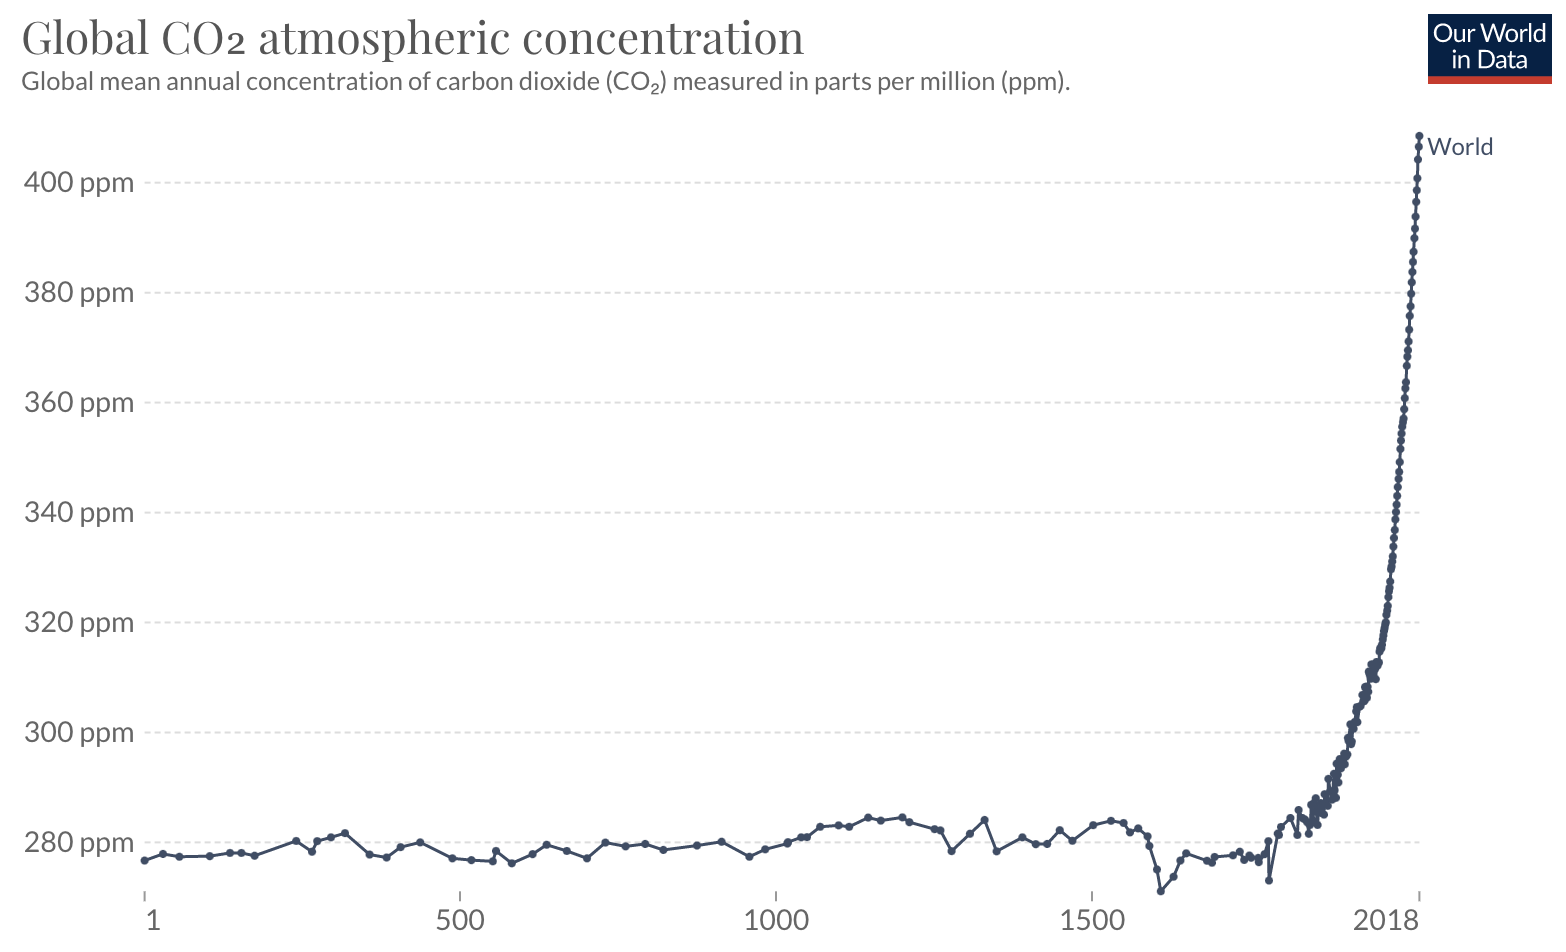
CO\(_2\)

CO\(_2\) and Temperature

CO\(_2\) and Temperature

CO\(_2\) and Temperature Rise

Berekely Earth Surface Temperature Project

“Conclusion: It appears that human (anthropogenic) effects can account for all of the trend in warming that we have observed over the past 250 years.”
Kyoto (Japan) Protocol
- International treaty
- UN framework convention on climate change
- Internationally-binding emission reduction targets
- 192 countries ratified; 37+EU cut
- Adopted: Dec. 1997
- Active: Feb. 2005

Kyoto (Japan) Protocol
- More strict for developed nations
- Commitment periods
- 2008-2012; reduce to 5% below 1990
- 37+EU binding
- 2013-2020 (Doha Amendment); reduce 18% below
- 2008-2012; reduce to 5% below 1990
- Trading system
- US, China
Paris Agreement
- Current pledges are not enough to achieve the goal
