---
title: "ChEn 433 Climate"
author: David Lignell
date: Class 4
lang: en-US
slideNumber: false
width: 1600
height: 1000
transition: fade
css: ../assets/style.css
theme: simple
title-slide-attributes:
data-background-image: "https://www.climate.gov/sites/default/files/GlobalTempTrend2014_updated_large.png"
data-background-opacity: "1.0"
verticator:
enable: true
menu:
enable: true
chalkboard:
enable: false
---
# Summary
* The impact of energy technologies on climate is often political and idealogical.
* As engineers, we strive to understand the data and form opinions based on data and scientific understanding.
Our understanding of climate change and drivers has evolved. Here's what we know:
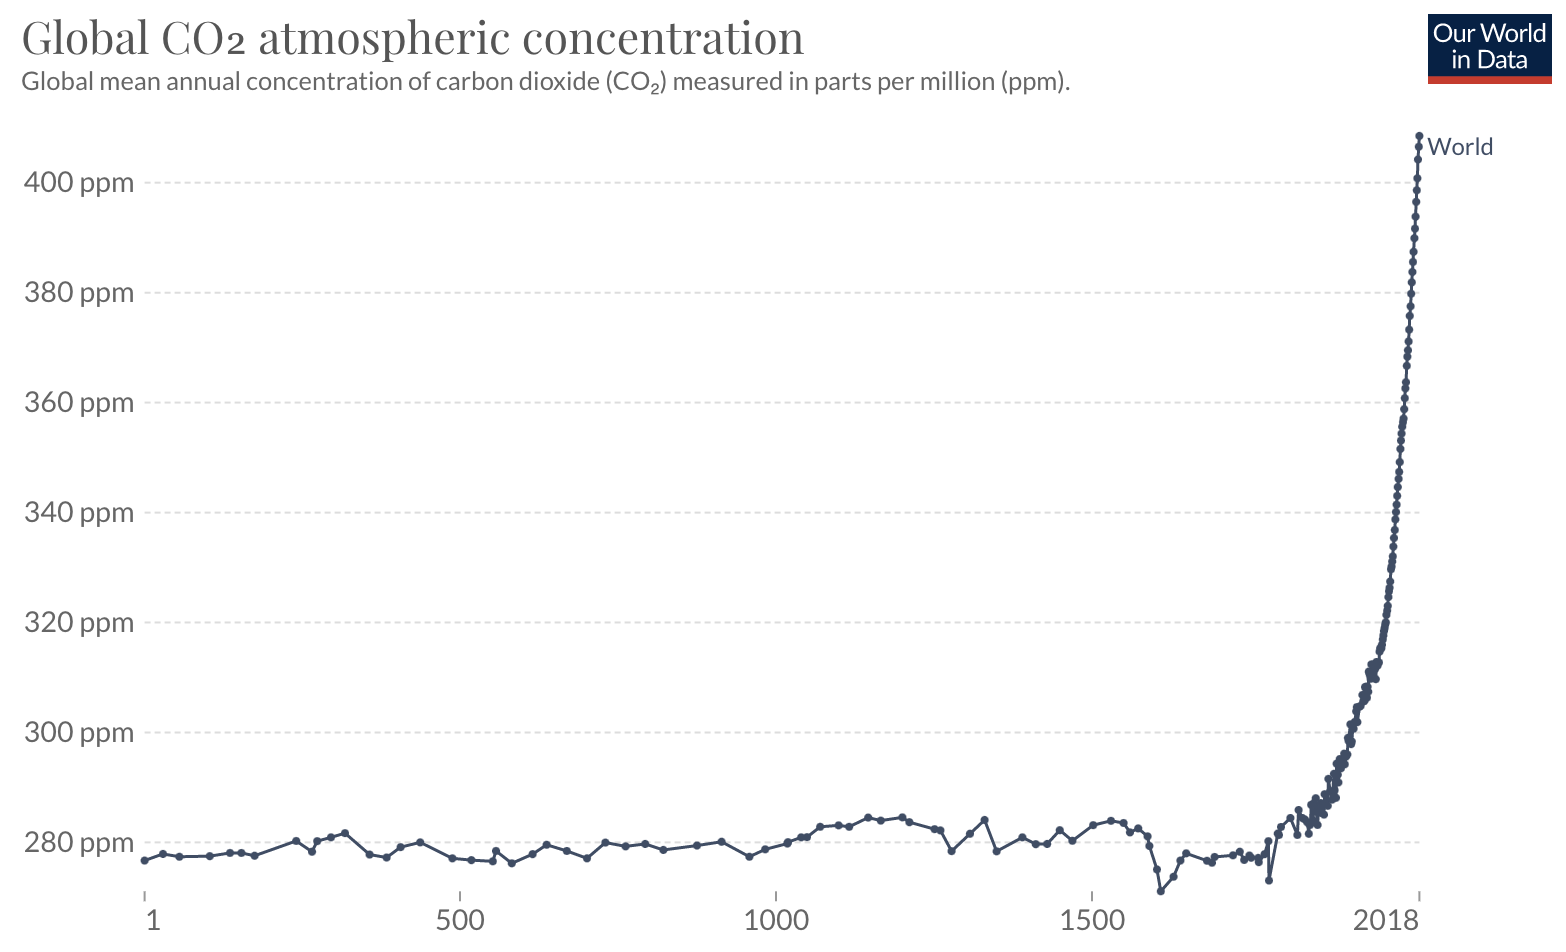
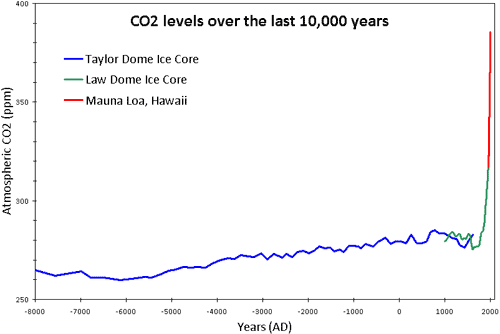
* CO2 concentrations in the atmosphere have increased from about 280 ppmv to 420 ppmv over the last 100 years.
* This has been caused by human activity.
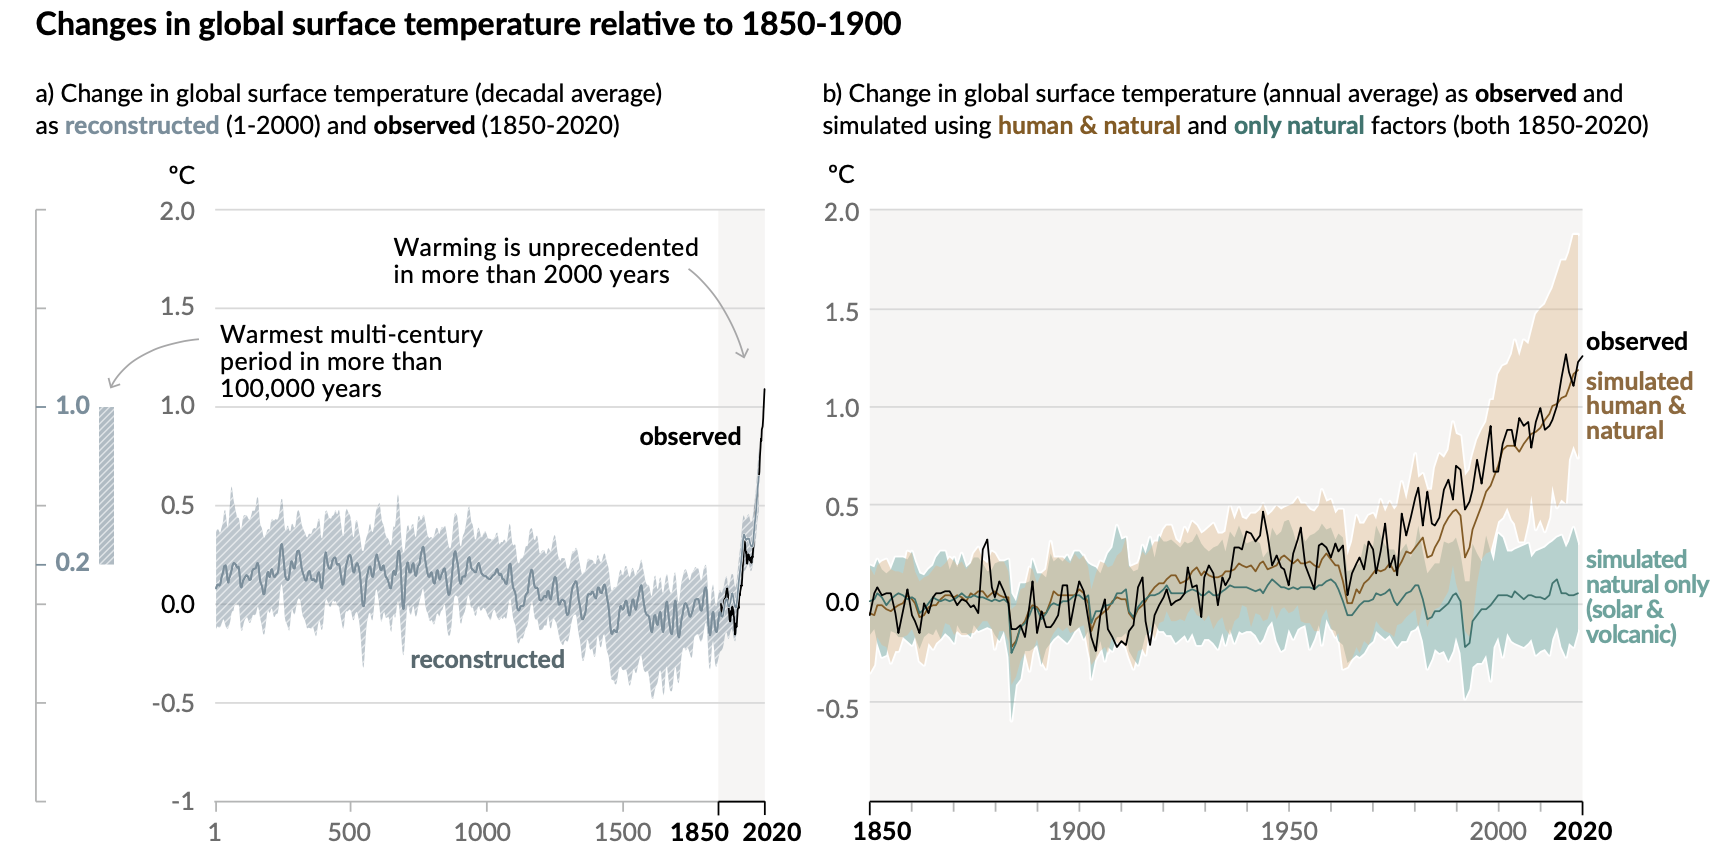
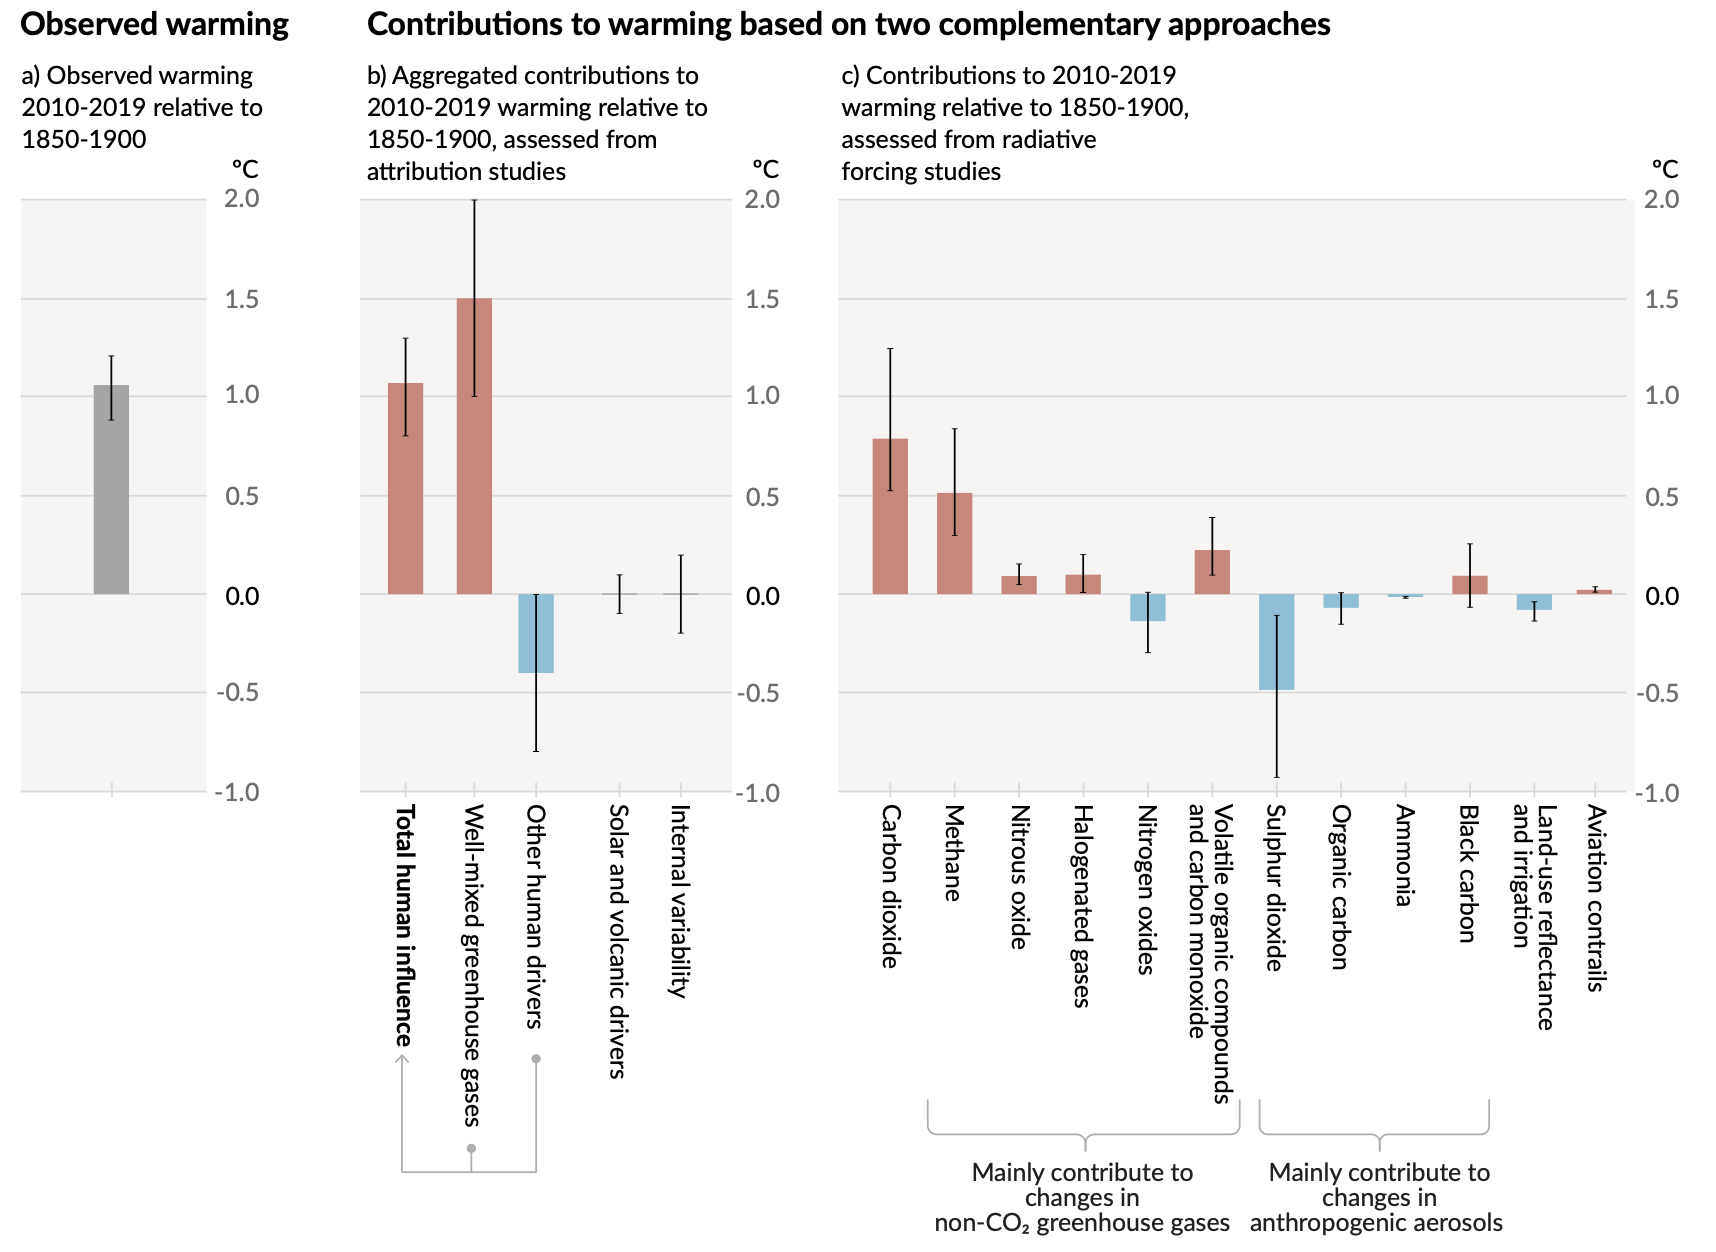
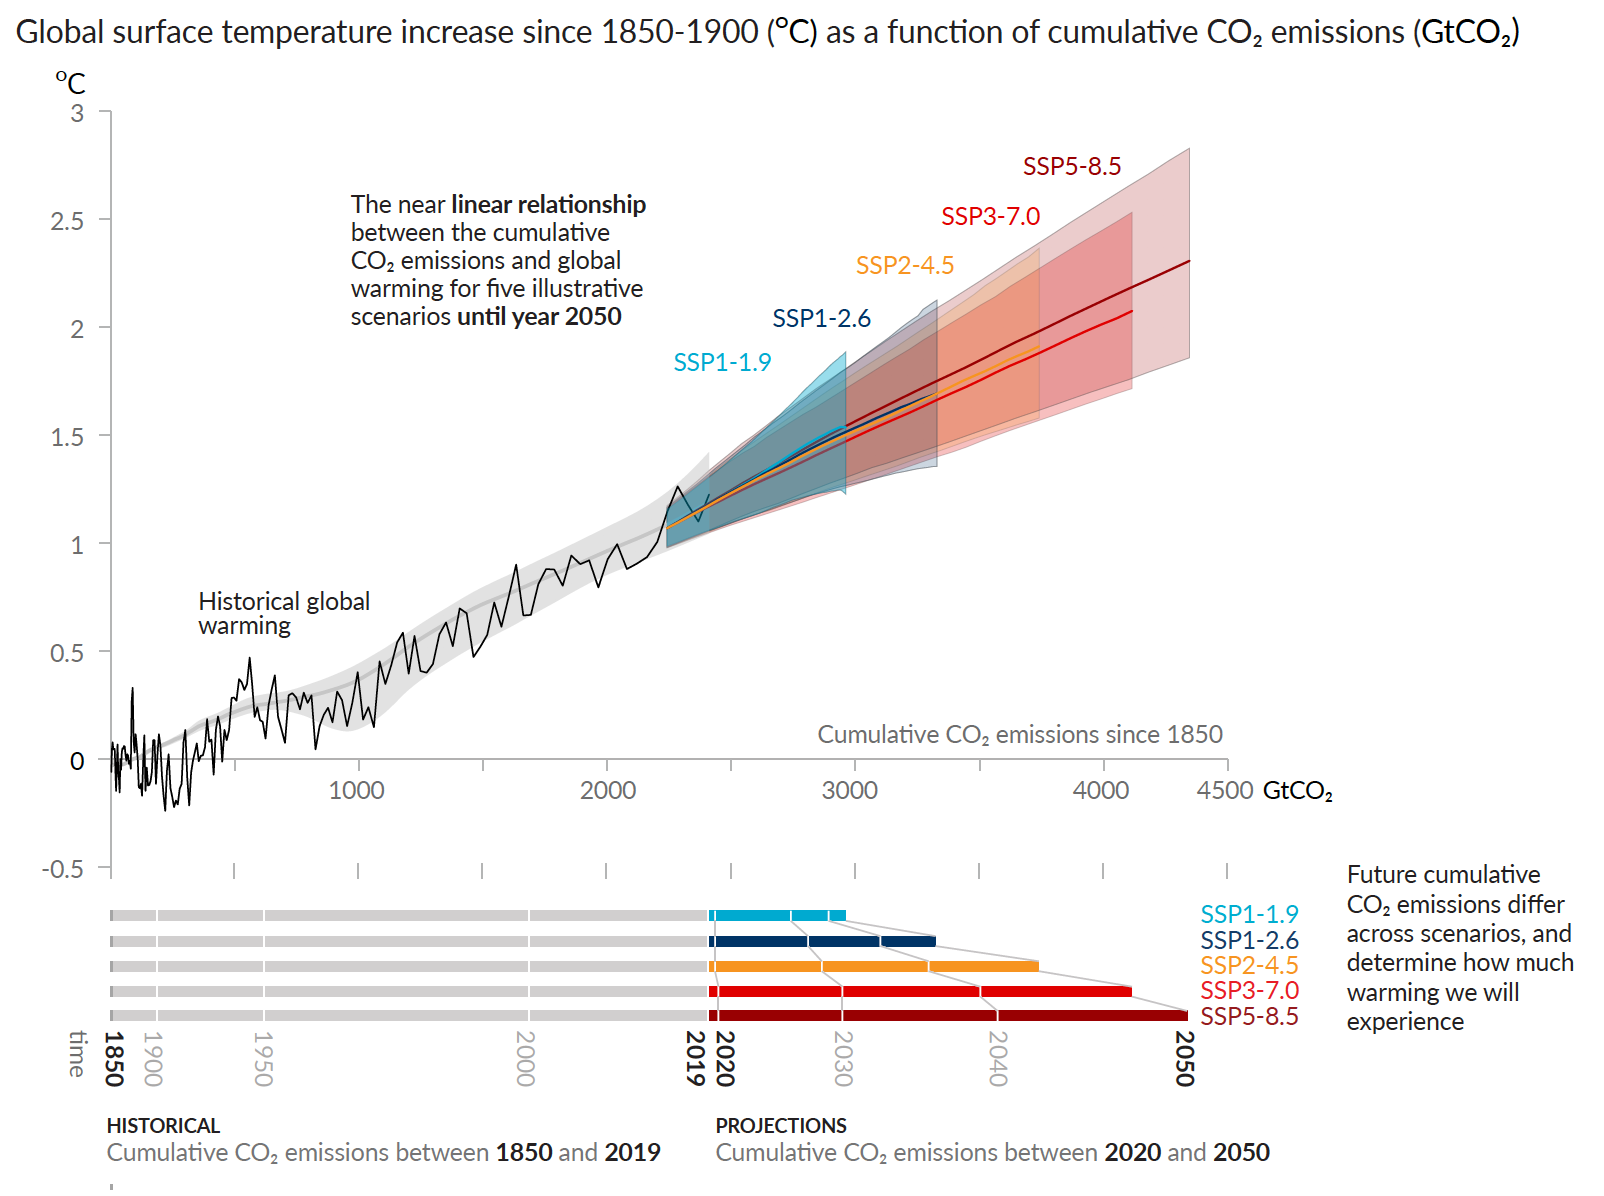
* Higher concentrations of greenhouse gases in the atmosphere result in higher temperatures and temperature changes are very strongly correlated with CO2 concentrations
* The world has warmed by 1.5 $^o$C over the past 250 years.
* Future effects of greenhouse gas emissions and concentrations have significant uncertainty.
# Greenhouse gases
:::::: {.cols2}
::: {.col2-l}
* References and discussion
* [Center for Climate and Energy Solutions](https://www.c2es.org/content/main-greenhouse-gases/)
* [Environmental Protection Agency](https://www.epa.gov/ghgemissions/overview-greenhouse-gases#carbon-dioxide)
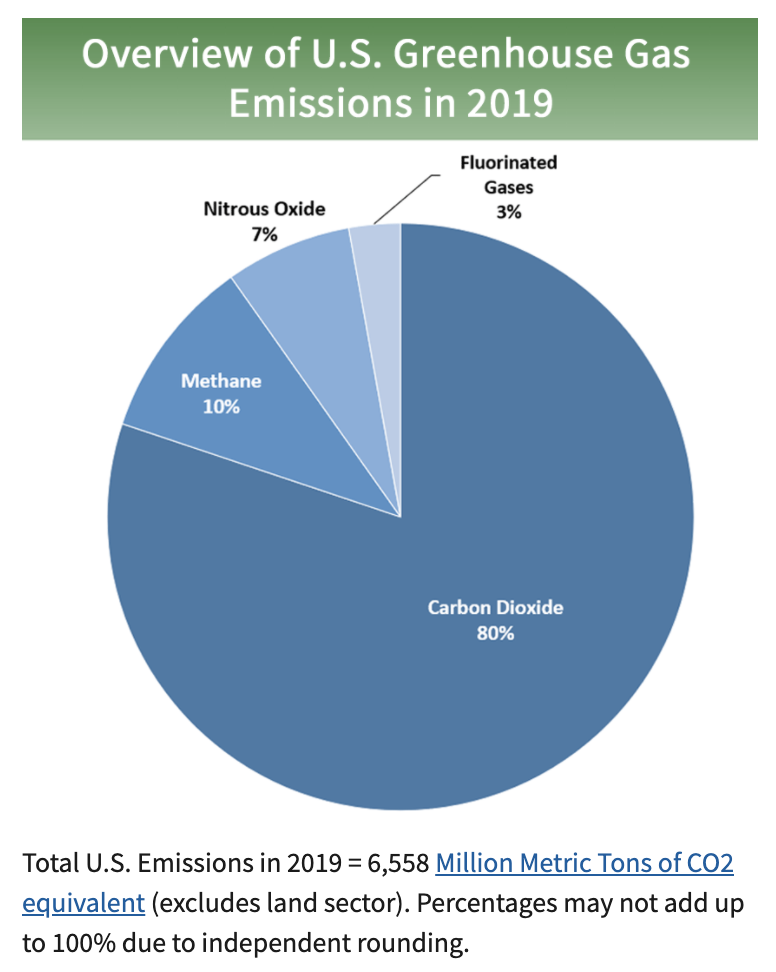
* CO$_2$
* Not a pollutant in the usual sense.
* Becomes such after prolonged emission on a massive scale, and through its effect on climate change
* CH$_4$
* N$_2$O
* HFCs
* PFCs
* SF$_6$
* NF$_3$
:::
::: {.col2-v}
:::
::::::
## Greenhouse gases
## CO$_2$
## CO$_2$
## CO$_2$, IPCC
* Intergovernmental panel on climate change
* United Nations
* 195 countries
* Reviews published literature
* Thousands of scientists
* Create assessment reports
* Currently in the seventh assessment cycle
* Cycles are 6-7 years long: 1990, 1996, 2001, 2007, 2014, 2022, ...
* Won the 2007 Nobel Prize
* [IPCC Summary for Policy Makers](https://www.ipcc.ch/report/ar6/wg1/downloads/report/IPCC_AR6_WGI_SPM.pdf)
* 32 pages. (The full report is several thousand pages long.)
## Greenhouse gases and climate change
>Observed increases in well-mixed greenhouse gas (GHG) concentrations since around 1750 are
unequivocally caused by human activities. Since 2011 (measurements reported in AR5), concentrations have
continued to increase in the atmosphere, reaching annual averages of 410 ppm for carbon dioxide (CO2),
1866 ppb for methane (CH4), and 332 ppb for nitrous oxide (N2O) in 2019. Land and ocean have taken up a
near-constant proportion (globally about 56% per year) of CO2 emissions from human activities over the past
six decades, with regional differences (high confidence) ---IPCC Summary for policy makers, AR6
## CO$_2$ and Temperature
Climate Proxies
::: notes
Long term temperatures are inferred using indirect indicators of temperature: tree ring widths, coral growth, etc.
:::
## CO$_2$ and Temperature
## CO$_2$ and Temperature Rise
## Temperature timeline
## "Ice Age Units"
# Temperature measurements
* Complaints (from book Energy for Future Presidents, chapter 3)
* Thermometers poorly placed: buildings, asphalt, heat sources
* Groups had adjusted the data: changes in instruments, locations.
* Urban heat island effect.
* Not all data were used (e.g., preferring stations with long records)
::: fragment
* [Berekely Earth Surface Temperature Project](http://www.BerkeleyEarth.org)
* 2009
* ~40,000 stations
* 1.6 billion temperature measurements
* New statistical methods
* Careful
* Avoided data selection bias (used all the data)
* Station quality bias checked (analyzed good and bad stations separately)
* Urban heat bias; compare rural with total
* Correction bias; compare without any corrections.
:::
::: fragment
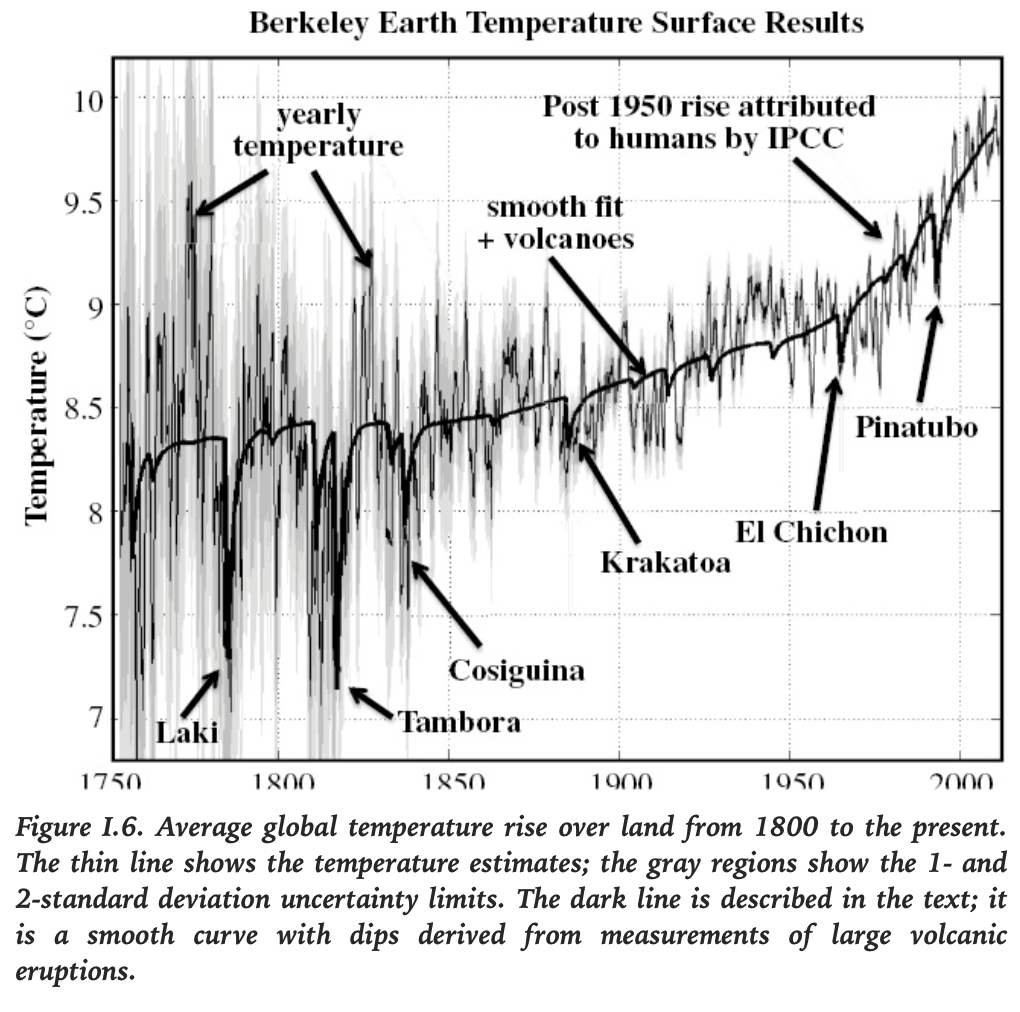
**Their unexpected result: confirmed the IPCC temperature rise ~0.9 C over land.**
:::
## [Berekely Earth Surface Temperature Project](http://www.BerkeleyEarth.org)
::: fragment
"Conclusion: It appears that human (anthropogenic) effects can account for all of the trend in warming that we have observed over the past 250 years."
:::
::: notes
Black line through the middel is the known and measured CO2 data curve (with corrected scale).
(technically the log of CO2 due to physics of CO2 absorption lines).
This is a one-parameter-fit, the scale of the curve!
Adding sunspot variability didn't improve the fit: "The optimum-fit combination of co2 and sunspots set the sunspot component statistically equal to zero.
:::
# Kyoto (Japan) Protocol
::: {.columns}
::: {.column}
* [International treaty](https://unfccc.int/kyoto_protocol)
* [UN framework convention on climate change](https://unfccc.int/files/press/backgrounders/application/pdf/fact_sheet_the_kyoto_protocol.pdf)
* Internationally-binding emission reduction targets
* 192 countries ratified; 37+EU cut
* Adopted: Dec. 1997
* Active: Feb. 2005
:::
::: {.column}
:::
:::
## Kyoto (Japan) Protocol
::: {.columns}
::: {.column}
* More strict for developed nations
* Commitment periods
* 2008-2012; reduce to 5% below 1990
* 37+EU binding
* 2013-2020 (Doha Amendment); reduce 18% below
* Trading system
* US, China
:::
::: {.column}
:::
:::
::: notes
US never ratified; [Didn't like](https://www.lenntech.com/greenhouse-effect/kyoto-united-states.htm) developed nations not in (half emissions 2025 from developing c.)
China exempt;
Canada withdrew (if china us not in, why bother)
:::
## Paris Agreement
::: {.columns}
::: {.column}
* [2015, (2016 in force)](https://unfccc.int/process-and-meetings/the-paris-agreement/the-paris-agreement)
* 191 countries
* US is out/in...
* Develop, plan, report
* Limit warming < 2 $^o$C, $\lesssim$ 1.5 $^o$C.
* Climate neutral by ~2050
* 5 year cycle
:::
::: {.column}
:::
:::
## Paris Agreement
::: {.columns}
::: {.column}
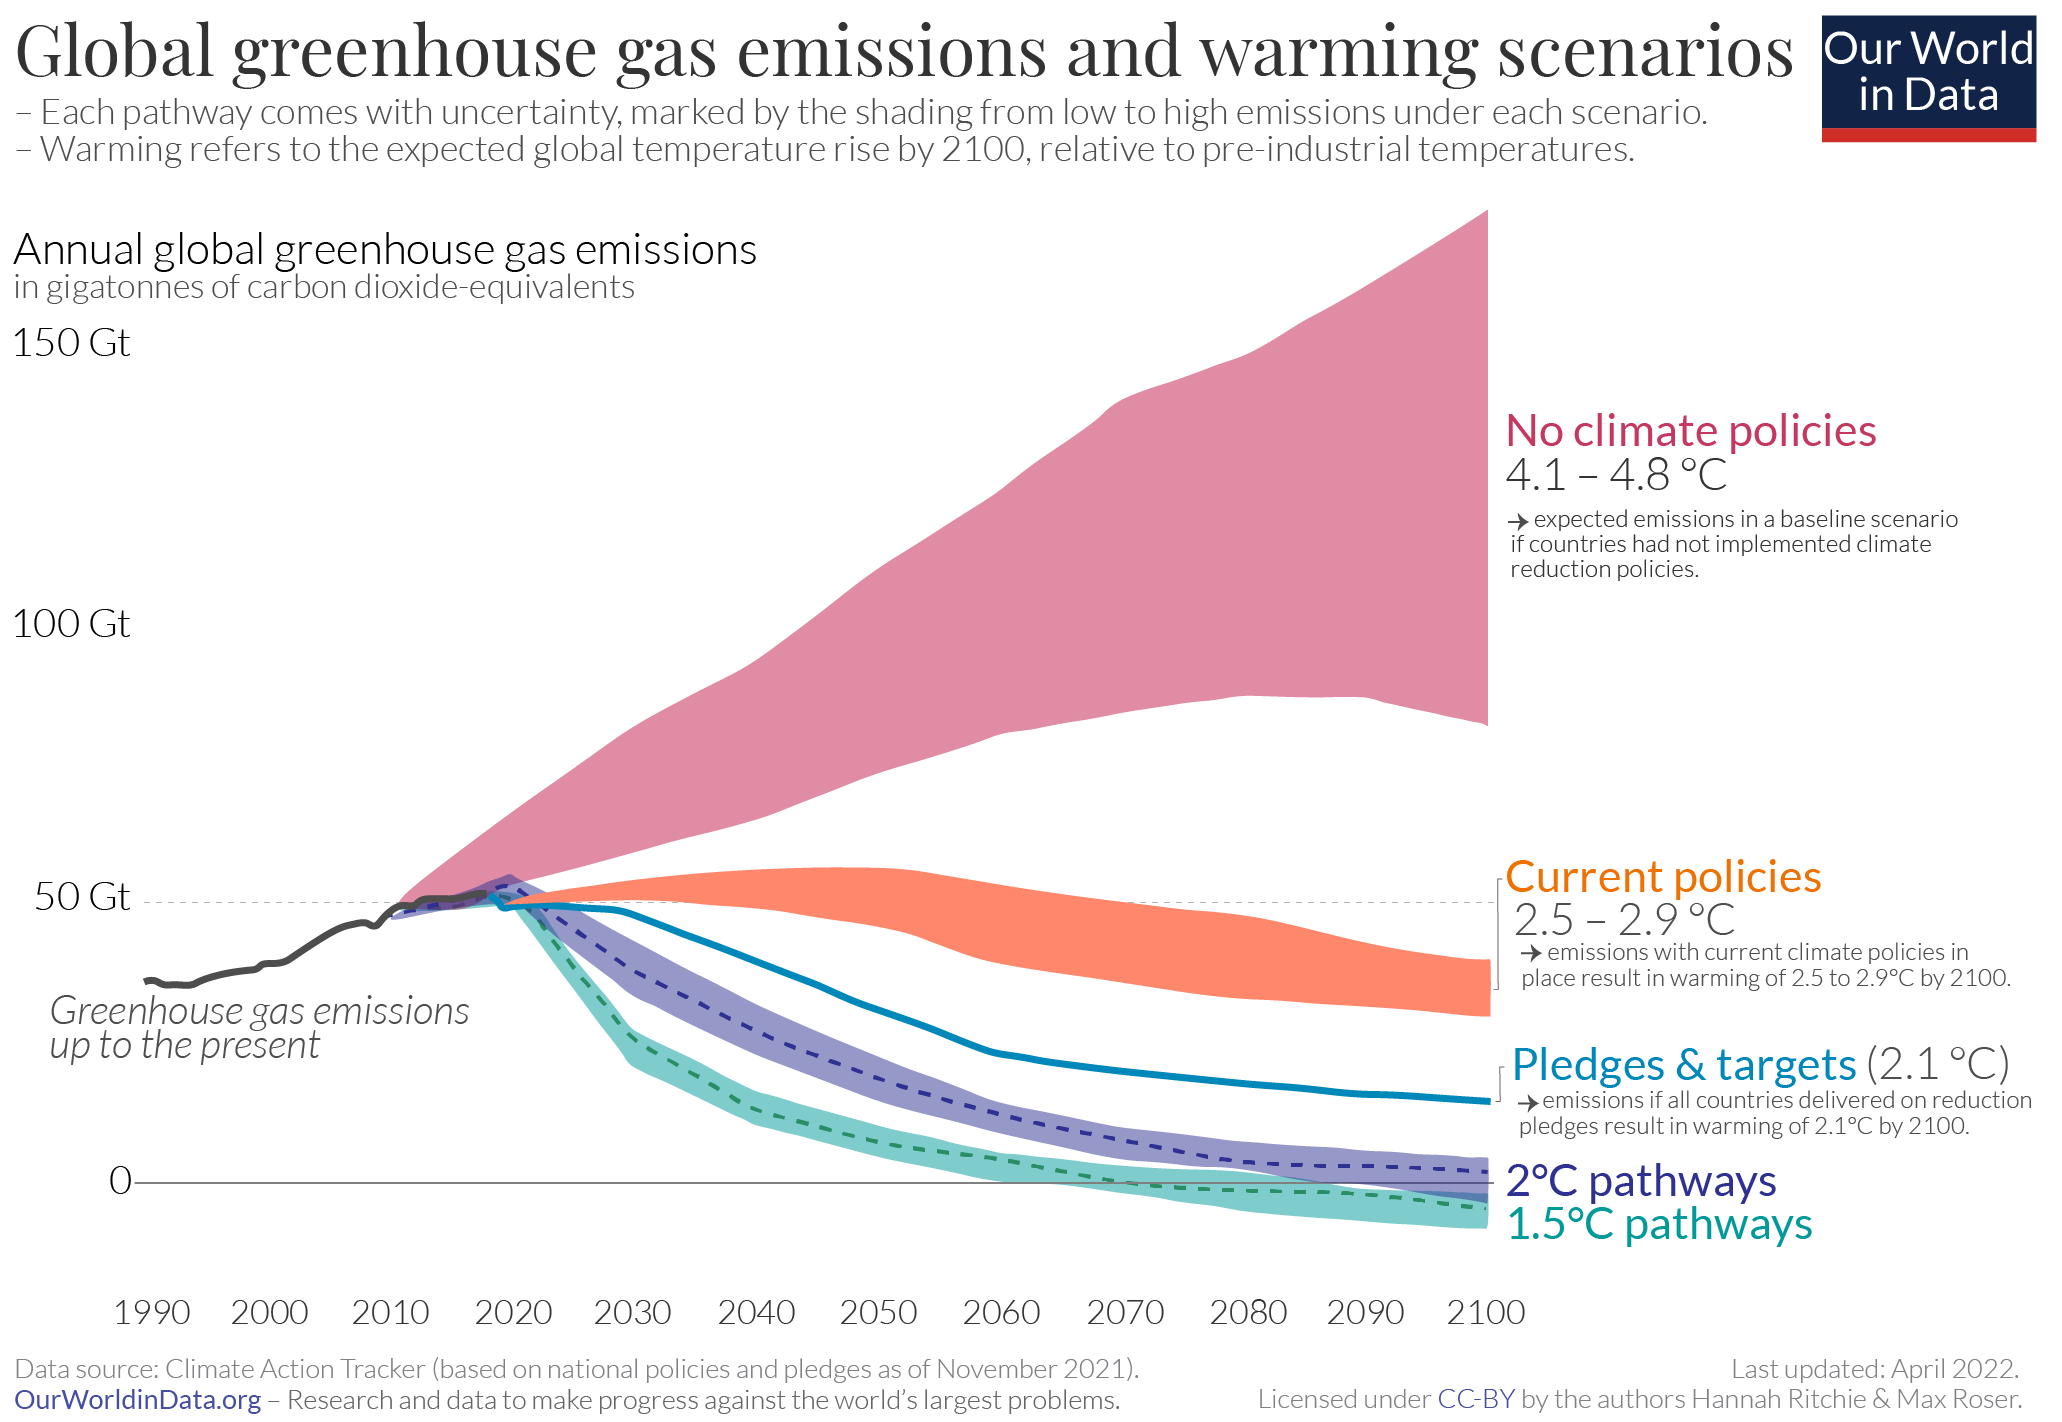
* Current pledges are not enough to achieve the goal
:::
::: {.column}
:::
:::
 :::
::::::
## Greenhouse gases
## CO$_2$
:::
::::::
## Greenhouse gases
## CO$_2$
 ## CO$_2$, IPCC
* Intergovernmental panel on climate change
* United Nations
* 195 countries
* Reviews published literature
* Thousands of scientists
* Create assessment reports
* Currently in the seventh assessment cycle
* Cycles are 6-7 years long: 1990, 1996, 2001, 2007, 2014, 2022, ...
* Won the 2007 Nobel Prize
* [IPCC Summary for Policy Makers](https://www.ipcc.ch/report/ar6/wg1/downloads/report/IPCC_AR6_WGI_SPM.pdf)
* 32 pages. (The full report is several thousand pages long.)
## Greenhouse gases and climate change
>Observed increases in well-mixed greenhouse gas (GHG) concentrations since around 1750 are
unequivocally caused by human activities. Since 2011 (measurements reported in AR5), concentrations have
continued to increase in the atmosphere, reaching annual averages of 410 ppm for carbon dioxide (CO2),
1866 ppb for methane (CH4), and 332 ppb for nitrous oxide (N2O) in 2019. Land and ocean have taken up a
near-constant proportion (globally about 56% per year) of CO2 emissions from human activities over the past
six decades, with regional differences (high confidence) ---IPCC Summary for policy makers, AR6
## CO$_2$ and Temperature
## CO$_2$, IPCC
* Intergovernmental panel on climate change
* United Nations
* 195 countries
* Reviews published literature
* Thousands of scientists
* Create assessment reports
* Currently in the seventh assessment cycle
* Cycles are 6-7 years long: 1990, 1996, 2001, 2007, 2014, 2022, ...
* Won the 2007 Nobel Prize
* [IPCC Summary for Policy Makers](https://www.ipcc.ch/report/ar6/wg1/downloads/report/IPCC_AR6_WGI_SPM.pdf)
* 32 pages. (The full report is several thousand pages long.)
## Greenhouse gases and climate change
>Observed increases in well-mixed greenhouse gas (GHG) concentrations since around 1750 are
unequivocally caused by human activities. Since 2011 (measurements reported in AR5), concentrations have
continued to increase in the atmosphere, reaching annual averages of 410 ppm for carbon dioxide (CO2),
1866 ppb for methane (CH4), and 332 ppb for nitrous oxide (N2O) in 2019. Land and ocean have taken up a
near-constant proportion (globally about 56% per year) of CO2 emissions from human activities over the past
six decades, with regional differences (high confidence) ---IPCC Summary for policy makers, AR6
## CO$_2$ and Temperature
 Climate Proxies
::: notes
Long term temperatures are inferred using indirect indicators of temperature: tree ring widths, coral growth, etc.
:::
## CO$_2$ and Temperature
Climate Proxies
::: notes
Long term temperatures are inferred using indirect indicators of temperature: tree ring widths, coral growth, etc.
:::
## CO$_2$ and Temperature
 ## CO$_2$ and Temperature Rise
 ## Temperature timeline
## "Ice Age Units"
# Temperature measurements
* Complaints (from book Energy for Future Presidents, chapter 3)
* Thermometers poorly placed: buildings, asphalt, heat sources
* Groups had adjusted the data: changes in instruments, locations.
* Urban heat island effect.
* Not all data were used (e.g., preferring stations with long records)
::: fragment
* [Berekely Earth Surface Temperature Project](http://www.BerkeleyEarth.org)
* 2009
* ~40,000 stations
* 1.6 billion temperature measurements
* New statistical methods
* Careful
* Avoided data selection bias (used all the data)
* Station quality bias checked (analyzed good and bad stations separately)
* Urban heat bias; compare rural with total
* Correction bias; compare without any corrections.
:::
::: fragment
**Their unexpected result: confirmed the IPCC temperature rise ~0.9 C over land.**
:::
## [Berekely Earth Surface Temperature Project](http://www.BerkeleyEarth.org)
## Temperature timeline
## "Ice Age Units"
# Temperature measurements
* Complaints (from book Energy for Future Presidents, chapter 3)
* Thermometers poorly placed: buildings, asphalt, heat sources
* Groups had adjusted the data: changes in instruments, locations.
* Urban heat island effect.
* Not all data were used (e.g., preferring stations with long records)
::: fragment
* [Berekely Earth Surface Temperature Project](http://www.BerkeleyEarth.org)
* 2009
* ~40,000 stations
* 1.6 billion temperature measurements
* New statistical methods
* Careful
* Avoided data selection bias (used all the data)
* Station quality bias checked (analyzed good and bad stations separately)
* Urban heat bias; compare rural with total
* Correction bias; compare without any corrections.
:::
::: fragment
**Their unexpected result: confirmed the IPCC temperature rise ~0.9 C over land.**
:::
## [Berekely Earth Surface Temperature Project](http://www.BerkeleyEarth.org)
 ::: fragment
"Conclusion: It appears that human (anthropogenic) effects can account for all of the trend in warming that we have observed over the past 250 years."
:::
::: notes
Black line through the middel is the known and measured CO2 data curve (with corrected scale).
(technically the log of CO2 due to physics of CO2 absorption lines).
This is a one-parameter-fit, the scale of the curve!
Adding sunspot variability didn't improve the fit: "The optimum-fit combination of co2 and sunspots set the sunspot component statistically equal to zero.
:::
# Kyoto (Japan) Protocol
::: {.columns}
::: {.column}
* [International treaty](https://unfccc.int/kyoto_protocol)
* [UN framework convention on climate change](https://unfccc.int/files/press/backgrounders/application/pdf/fact_sheet_the_kyoto_protocol.pdf)
* Internationally-binding emission reduction targets
* 192 countries ratified; 37+EU cut
* Adopted: Dec. 1997
* Active: Feb. 2005
:::
::: {.column}
::: fragment
"Conclusion: It appears that human (anthropogenic) effects can account for all of the trend in warming that we have observed over the past 250 years."
:::
::: notes
Black line through the middel is the known and measured CO2 data curve (with corrected scale).
(technically the log of CO2 due to physics of CO2 absorption lines).
This is a one-parameter-fit, the scale of the curve!
Adding sunspot variability didn't improve the fit: "The optimum-fit combination of co2 and sunspots set the sunspot component statistically equal to zero.
:::
# Kyoto (Japan) Protocol
::: {.columns}
::: {.column}
* [International treaty](https://unfccc.int/kyoto_protocol)
* [UN framework convention on climate change](https://unfccc.int/files/press/backgrounders/application/pdf/fact_sheet_the_kyoto_protocol.pdf)
* Internationally-binding emission reduction targets
* 192 countries ratified; 37+EU cut
* Adopted: Dec. 1997
* Active: Feb. 2005
:::
::: {.column}
 :::
:::
## Kyoto (Japan) Protocol
::: {.columns}
::: {.column}
* More strict for developed nations
* Commitment periods
* 2008-2012; reduce to 5% below 1990
* 37+EU binding
* 2013-2020 (Doha Amendment); reduce 18% below
* Trading system
* US, China
:::
::: {.column}
:::
:::
## Kyoto (Japan) Protocol
::: {.columns}
::: {.column}
* More strict for developed nations
* Commitment periods
* 2008-2012; reduce to 5% below 1990
* 37+EU binding
* 2013-2020 (Doha Amendment); reduce 18% below
* Trading system
* US, China
:::
::: {.column}
 :::
:::
:::
:::