ChEn 433 Energy Use
US Energy Use
US Energy Sectors
US Energy Sectors
Note the factors: 1/3 (roughly)
Sources
- Petroleum: 1/3
- Natural Gas: 1/3
- Other: 1/3
- Renewable
- Coal
- Nuclear
End Uses
- Transportation: 1/3
- Industrial: 1/3
- Other: 1/3
- Residential
- Commercial
US Electric Generation
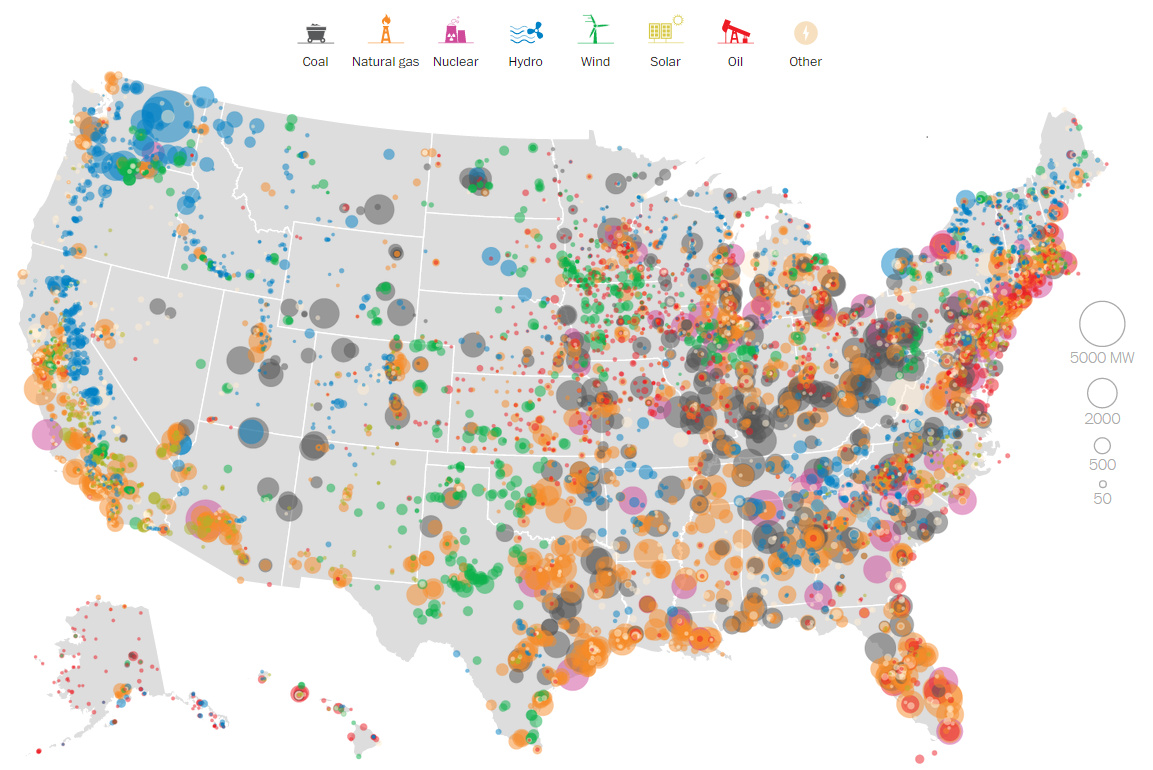
See also this Washington Post article
Amounts and splits
- Why is it important to know energy amounts by type and by use sector?
- Issues
- Conservation
- Energy technology changes
- Economics, politics, etc.
- The overall impact needs to be weighted by the
impact to the “sector” times the importances of the sector.
- There’s a name for this ➔ ?
- Base rate fallacy
Base rate fallacy: NPR
Base rate fallacy: simple example
- Utah drought
- The Great Salt Lake is dying (or already dead?).
To bring the lake back to a healthy state would require approximately 29% of additional water resources to be directed back into the lake’s tributaries and the lake itself. —The water that couldn’t save, Deseret News
- Municipal use
is around 10%; 75%
goes to agriculture (statewide though).
- If municipalities conserved 30%, that would only account for 3% of the needed 30% for the health of the lake.
Base rate fallacy example
- Suppose COVID tests have a 5% false positive rate
- meaning, whenever you don’t have COVID the test says you do 5% of the time.
- You get a positive result.
- What are the chances you really have it?
Need more information
Base rate fallacy example
- Suppose 1 in 80 people (1.25%) have COVID
- COVID test:
- 100% accurate if you have COVID,
- but has a 5% false positive rate
- You test positive
- What is the probability you actually have COVID?
- A. 95%
- B. 80%
- C. 20%
- D. 5%
- E. 1.25%
Base rate fallacy example
- If there were no false positives and you tested positive, you’d have it 100%
- Consider 80 people
- 1 has COVID
- 79 don’t
- positive tests:
- 1 that has COVID
- 79 * 5% = 3.95 who don’t
- chances of having COVID given the positive test = 1/(1+3.95) ≈ 1/5 = 20%
- Only 1/80 have it, but the test says 5/80 do.
- The question is, given a positive test what are the
chances of having COVID?
- The “base rate” is 5, not 80, and the answer is 1/5 not 1/80.
Base rate fallacy example: Bayes’ law
\[P(C|+)P(+) = P(+|C)P(C)\] \[P(C|+) = \frac{P(+|C)P(C)}{P(+)}\] \[P(C|+) = \frac{(1)(1/80)}{\underbrace{1/80}_{\mbox{+ test, have COVID}} + \underbrace{0.05(79/80)}_{\mbox{+ test, no COVID}}} = 20.2\%\]
Units
- What were the units of energy on the first couple
slides?
- Quadrillion Btu (per year)
- What’s a Quadrillion Btu?!
Units
The US generated 4494 Terawatt-hours
of electricity in 2023.
Convert this to the following units:
- Quadrillion BTUs in 2023
- Gigawatts (GW)
- Number of average size (world) coal power plants at 878 MW each; use a capacity factor of 0.8.
- Number of wind turbines at 3 MW; use a capacity factor of 0.3.
- Number of olympic size swimming pools vaporized per minute (heated from 25 C, then boiled).
- Number of cubic miles of oil (oil equivalent, that is, needed to produce the electricity).
- Number of Boeing 747 flights around the world

There is something wrong with second two bullets? Can you see what it is?
Capacity, Availability, Efficiency
- Availability factor is the fraction of time a plant can produce power
- Capacity factor is the power output in some time
period divided by the maximum possible output.
- Capacity factor is lower than availability
- Since the plant might not always be running at full power.
- For solar, availability is like the fraction of time the sun is
shining.
- capacity factor accounts for this and the fact that the sunlight isn’t always at it’s peak power (time of day/year, clouds, etc.)
- Efficiency in power production is the electricity
produced divided by the energy input.
- Coal plant: electricity produced divided by the heat energy of the coal burned
- Solar: electricity produced divided by the solar energy striking the panels
- Hydro: electricity produced divided by the potential energy change of the water
Capacity factor
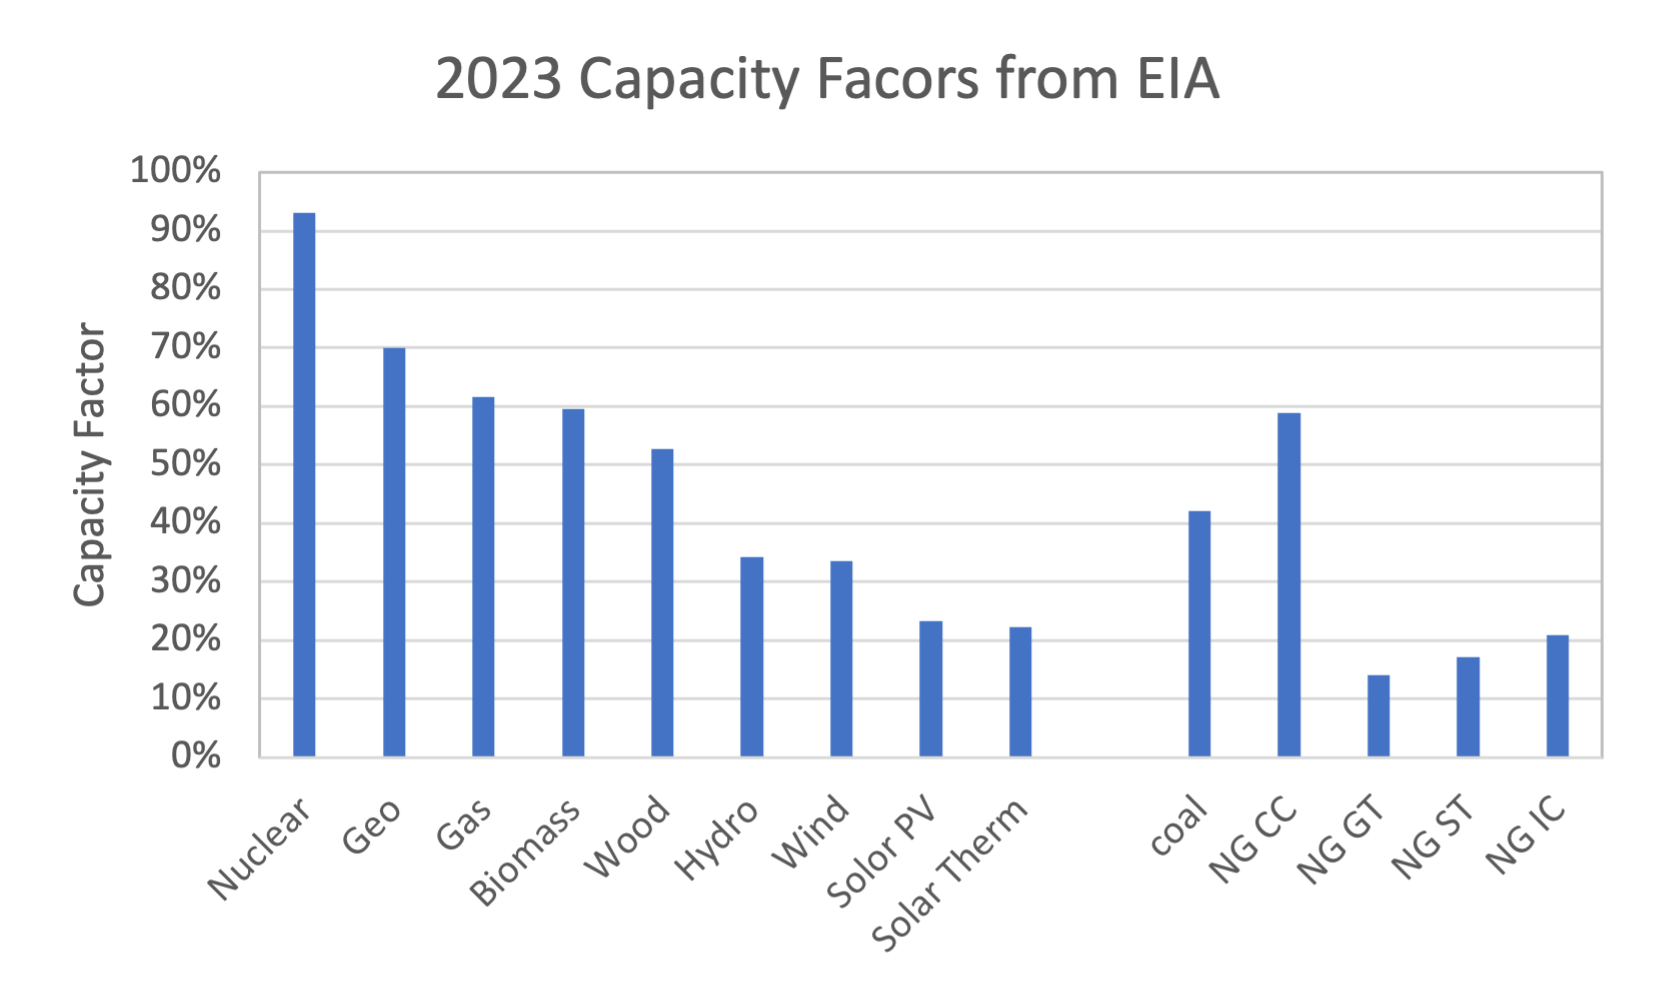
These are actual utilizations, not necessarily the maximum possible capacity factors after considering maintenance, etc., that is, availability
World energy use
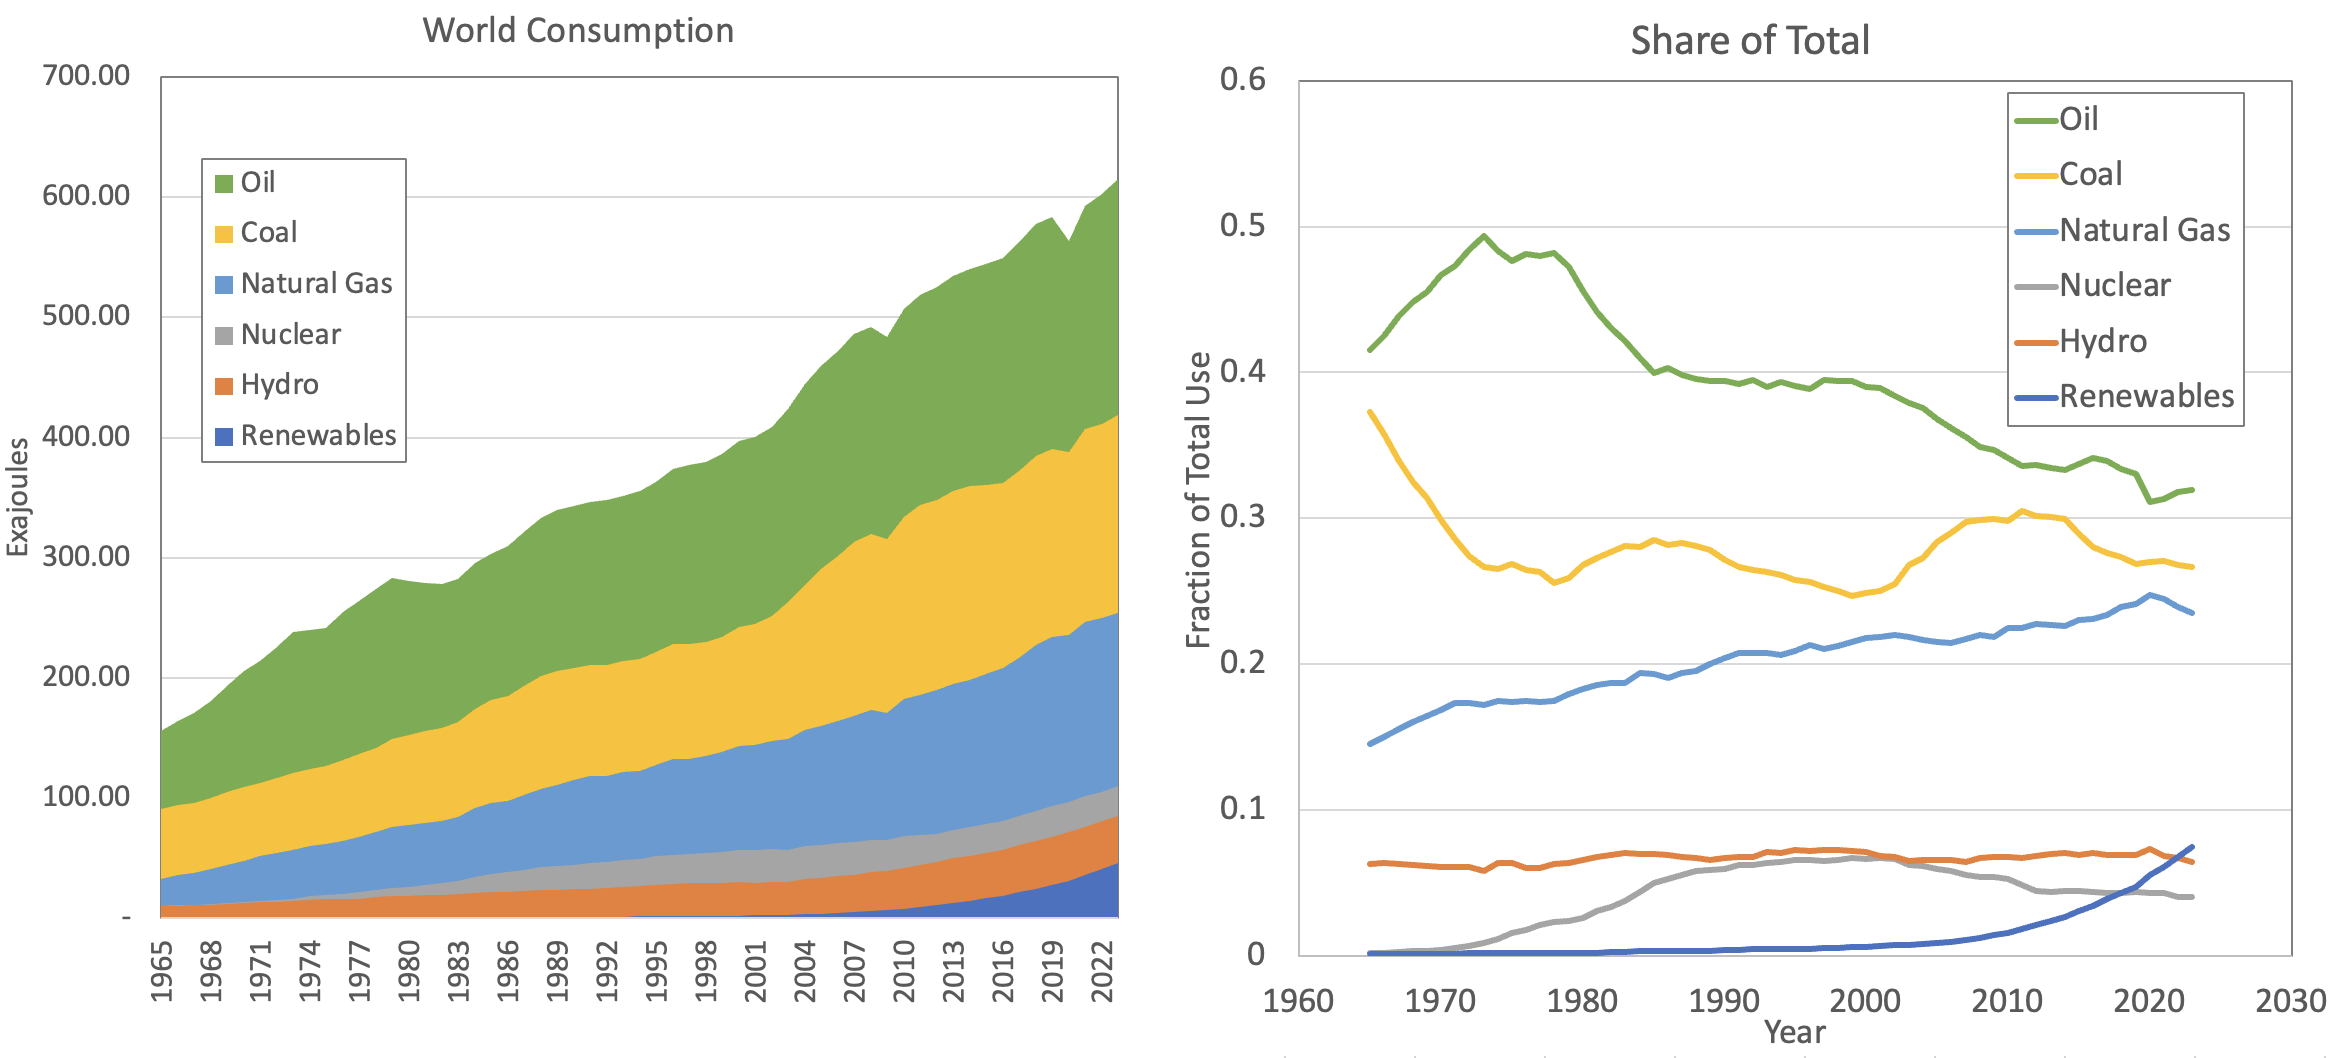
Energy use by country

- China and the US consume as much energy as the next 26 countries combined.
World energy consumption history
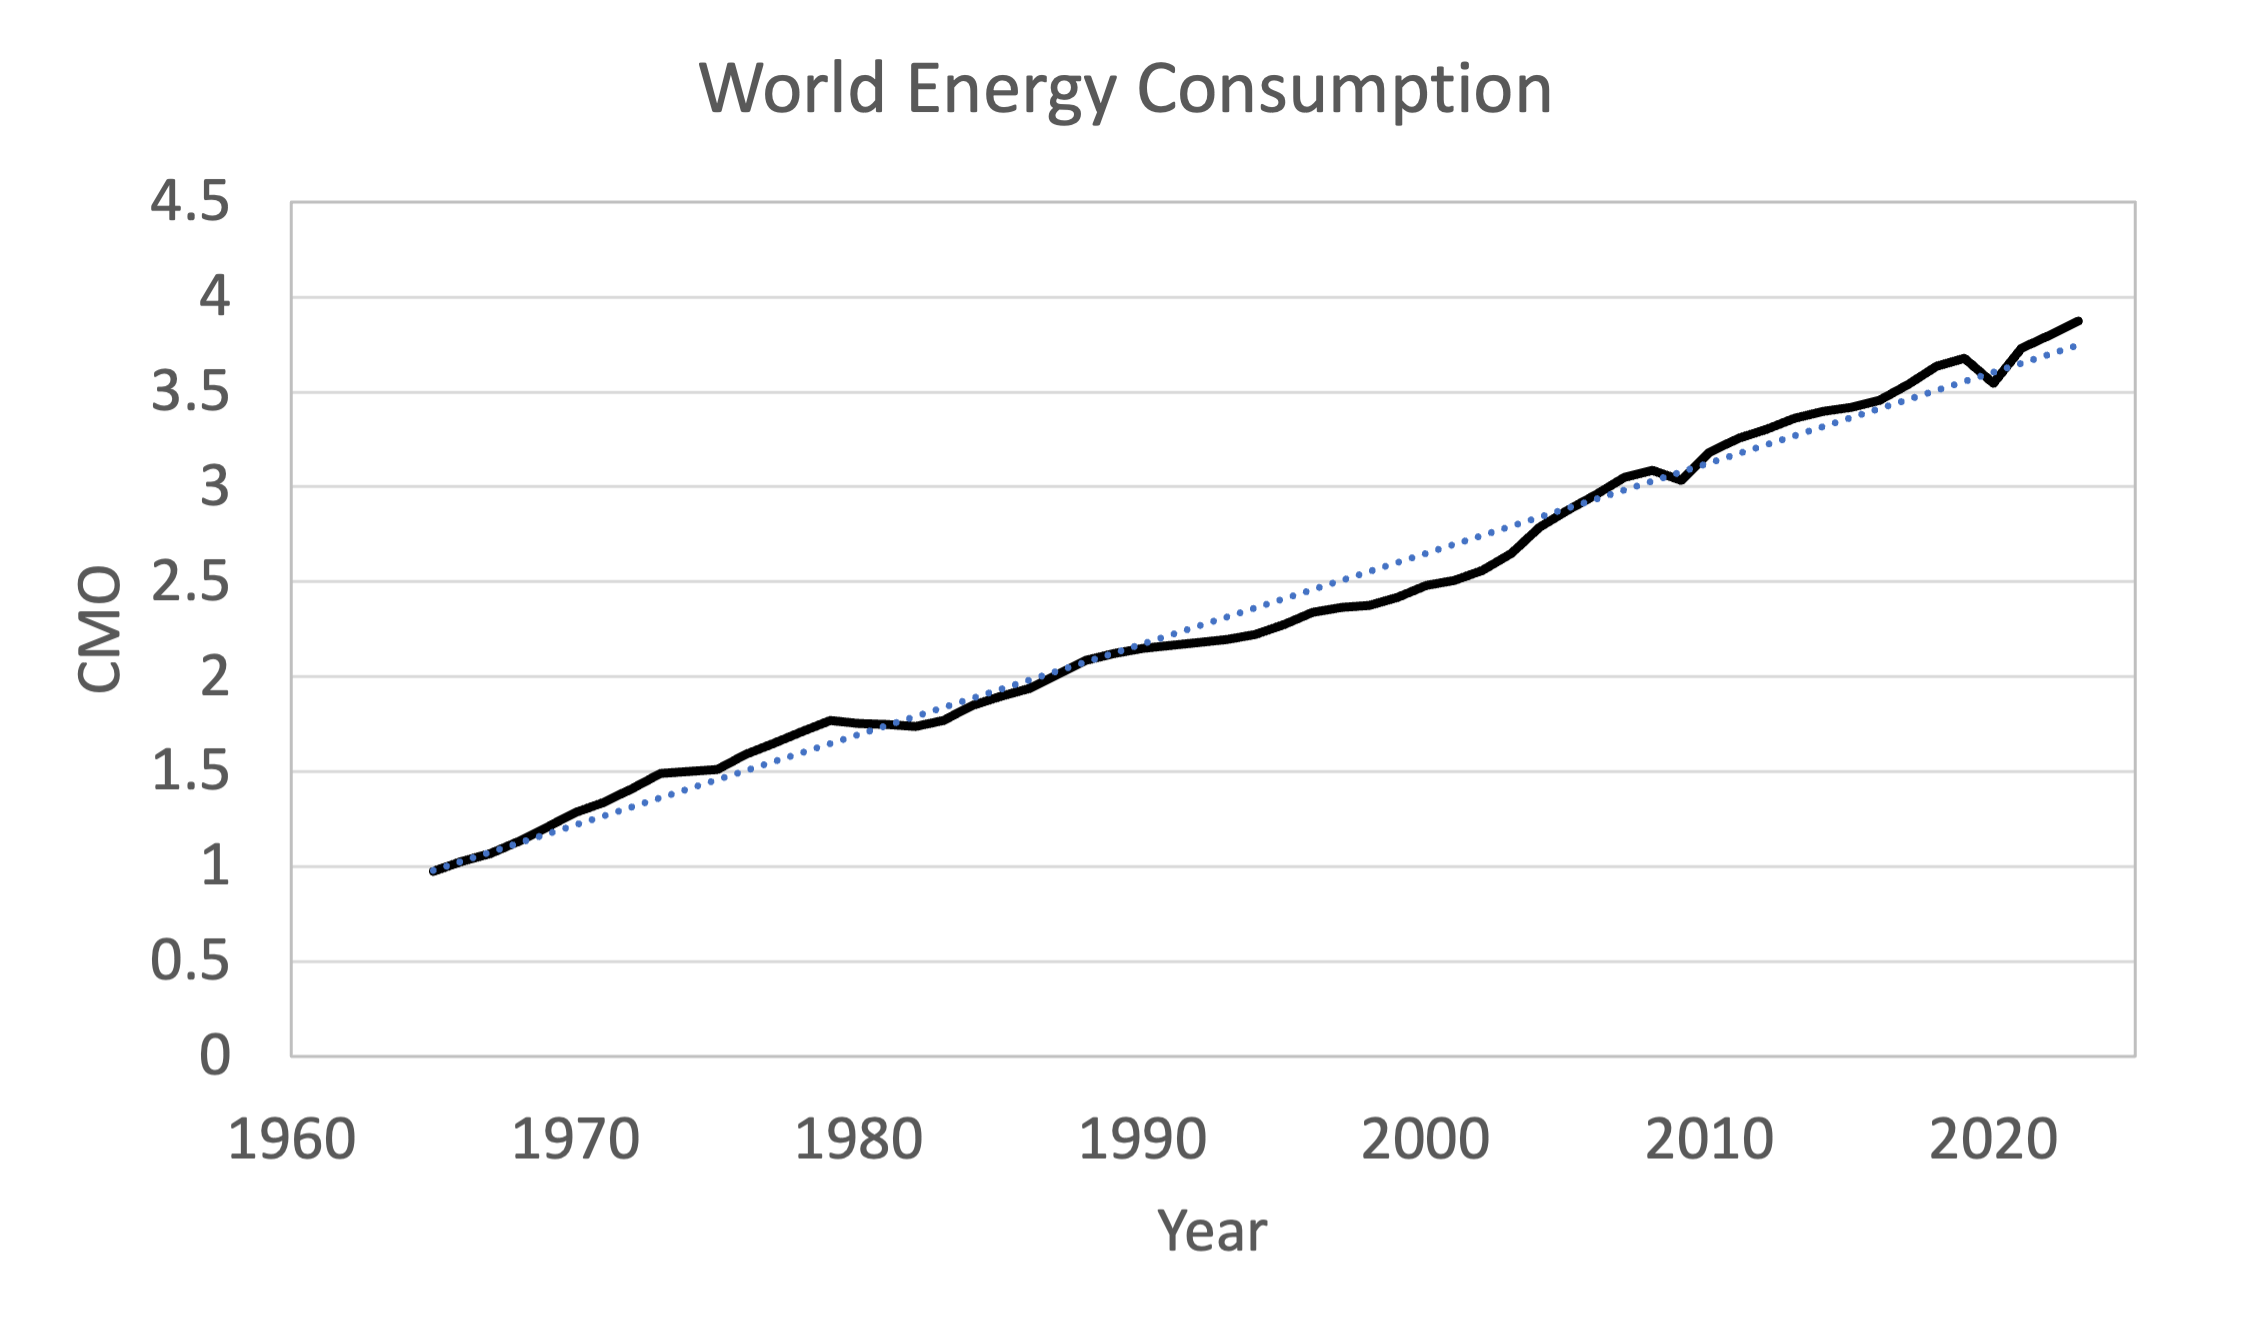
World energy consumption history

EI statistical review of world energy
Observations?
- Nearly linear trend over 60 years.
- This trend is scary when we think about the limited
nature of our primary energy sources.
- How many wars are fought over resources?
- Water, energy, food nexus
- This plot, and associated climate change drives the push for renewable energy.
- Compare this plot to economics/recession.
A sense of scale: Costs
Replacing the current world oil, gas, coal, and electricity production capacity could cost about $10 trillion (current [2010] dollars) or about one-fourth of annual GWP. In 2000, investment in energy supply systems was estimated to be 15-20% of total capital investment, or 3-4% GWP.
We need to bear in mind that these past investments have been worth many trillions of dollars, and no substantial change in the overall pattern of energy production or use will take place without comparable new investments. Investments on the order of $50 billion, such as those being made in nuclear power plants globally over the next decade, are substantial, but they pale compared with the total cost of the effort we face, which as we just saw runs into the tens of trillions of dollars. —Crane et al. “A Cubic Mile of Oil”
A sense of scale: 1 CMO of Wind Turbines
- 2,478,571 average sized land-based wind turbines
- Build 953 per week for 50 years
- 2 MW (typical)
- 8751 average
size land-based wind farms
- 566 MW each (the avg size above 250 MW)
- 283 turbines each at 1.65 MW
- Build 5 farms a week for 33 years
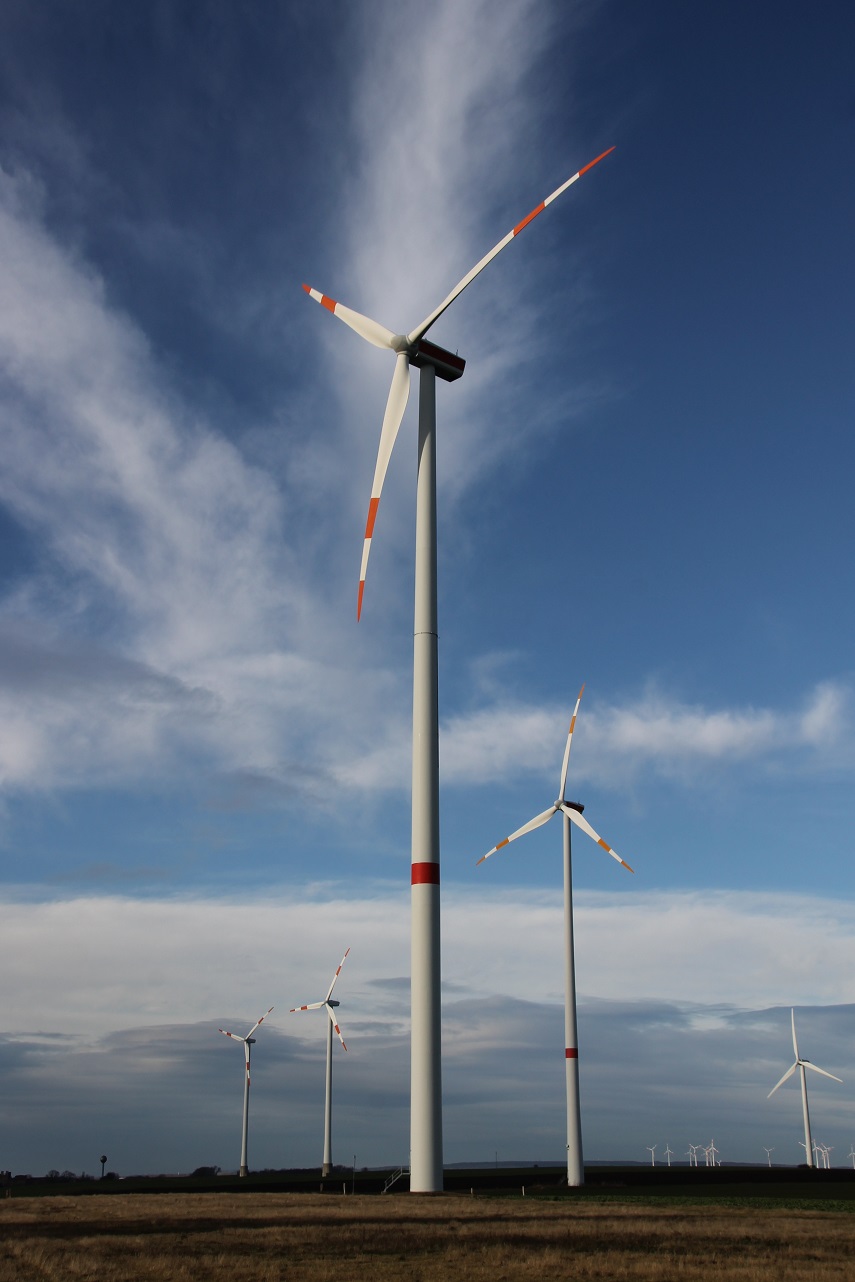
- Typical turbine: Vestas V90, 2 MW, 90 m diameter, 80 m high tower
- Using a 35% capacity factor.
3 CMO for typical wind farm area
A sense of scale: 1 CMO of Wind Turbines
- Questions?
- where to get the land?
- does the wind blow well there?
- how far away is the power destination?
- compare the copper (etc.) to the annual production.
- or amount of known resource.
- how long do they last?
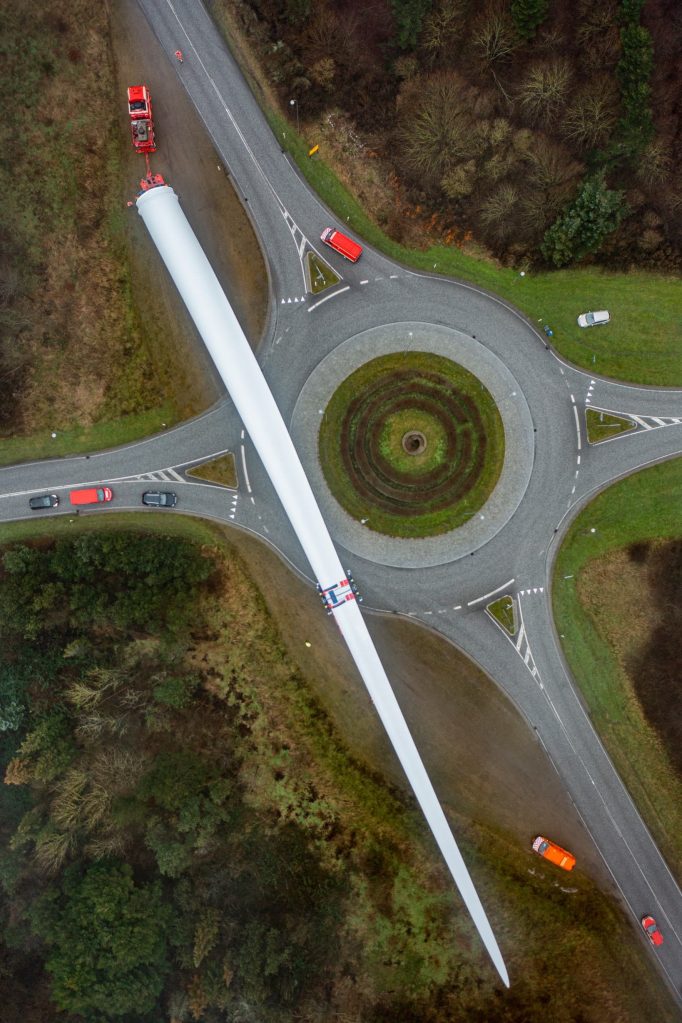
- can the blades be recycled, landfilled?
- affect on birds, noise, neighbors


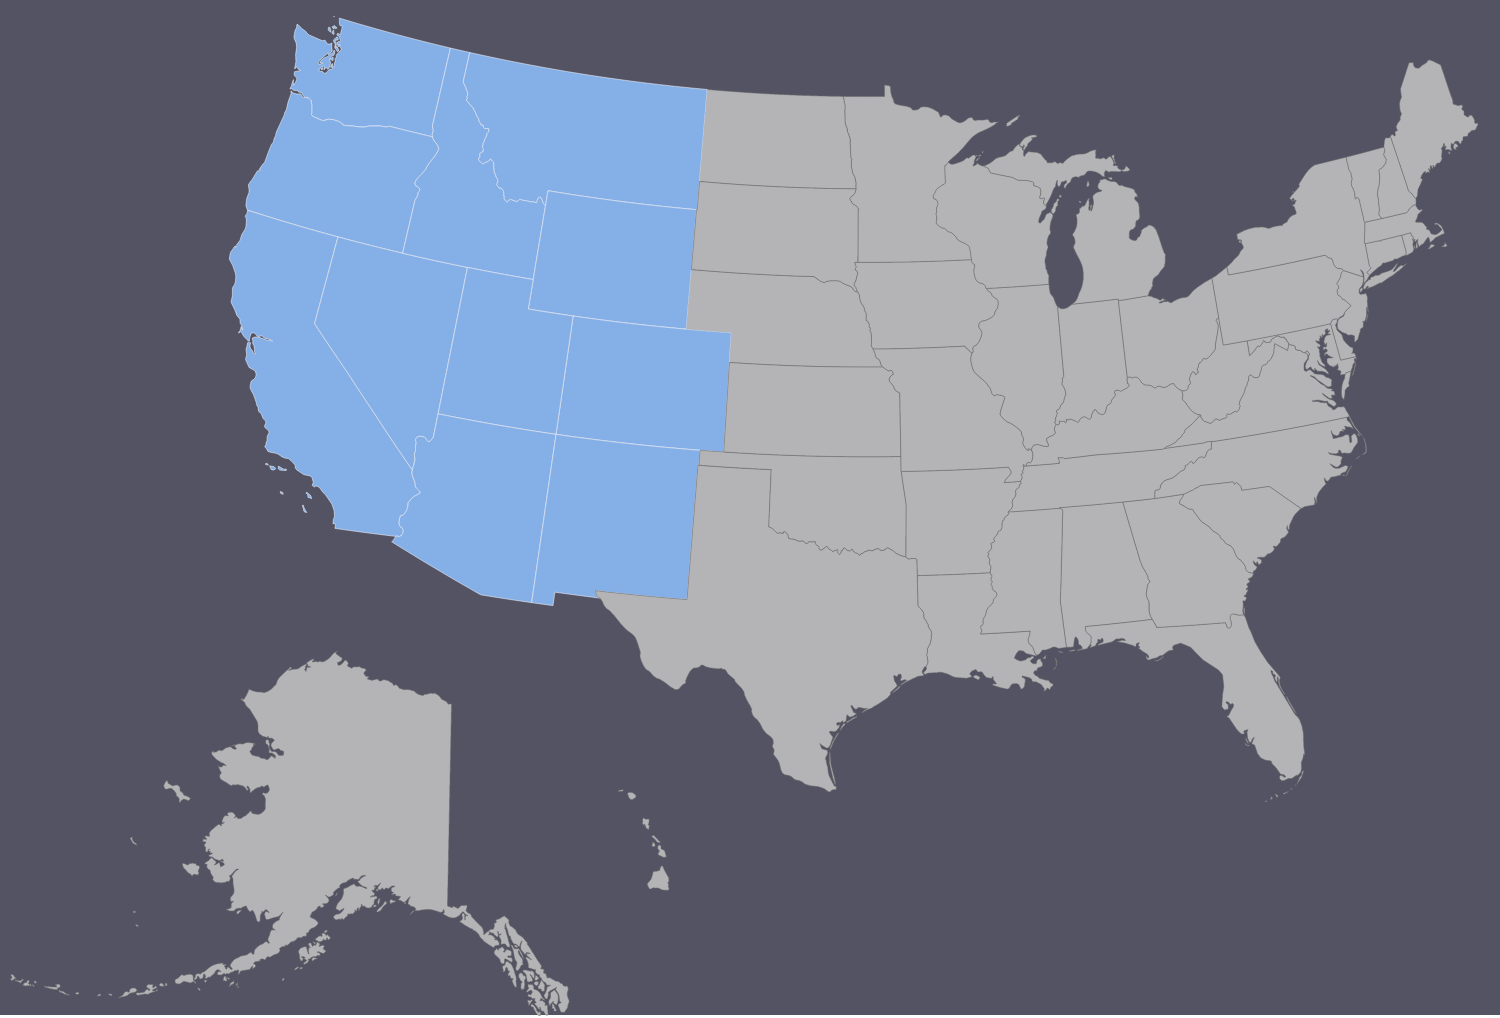
3 CMO for typical wind farm area